Understanding the relationship between two variables often involves analyzing the slope of the population's regression line, denoted as β. The slope β indicates the direction and strength of a linear correlation between variables. To determine if an observed linear trend in sample data is statistically significant and can be generalized to the population, a hypothesis test for β is conducted.
In this context, the null hypothesis (H0) always states that there is no linear correlation between the variables, meaning the population slope β = 0. The alternative hypothesis (Ha) depends on the research question: it can be two-sided (β ≠ 0) if testing for any linear relationship, or one-sided (β > 0 or β < 0) if testing for a positive or negative correlation specifically.
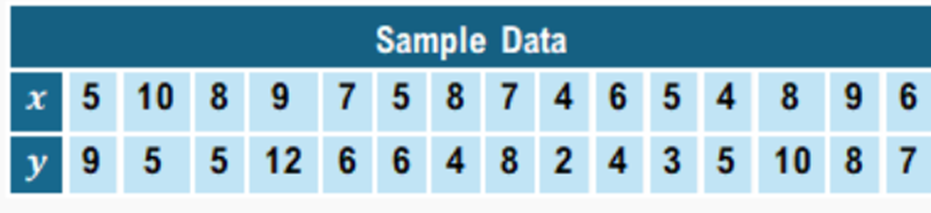
For example, consider an economic study examining the relationship between advertising spending and product sales (measured in thousands of dollars). To test the claim that no linear relationship exists at a significance level of α = 0.05, the hypotheses are set as:
H0: β = 0
Ha: β ≠ 0
Using statistical software or a graphing calculator like the TI-84, the data for advertising spending and sales are input into separate lists. The LinRegTTest function performs the hypothesis test for the slope β. This function calculates the test statistic t and the corresponding p-value, which quantifies the probability of observing the data assuming the null hypothesis is true.
When the p-value is less than the significance level α, the null hypothesis is rejected, indicating sufficient evidence to conclude that the population slope β is not zero. This implies a statistically significant linear correlation between the variables.
In the advertising and sales example, the calculated p-value was approximately 3.4 × 10⁻⁶, which is much smaller than 0.05. Therefore, the null hypothesis is rejected, supporting the conclusion that advertising spending and product sales have a significant linear relationship.
This process highlights the importance of hypothesis testing in regression analysis to validate whether observed trends in sample data reflect true relationships in the population. Mastery of these concepts enables accurate interpretation of correlation and causation in various fields such as economics, biology, and social sciences.