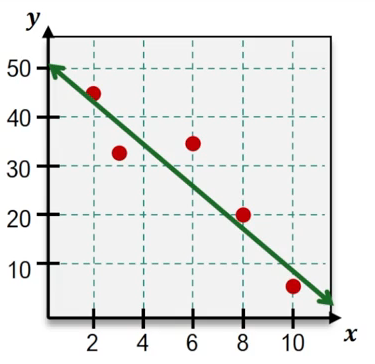
Scatter plots are a powerful tool for visualizing the relationship between two variables, typically represented as x and y values on a graph. When analyzing these plots, one may observe patterns or trends, such as a positive correlation, where an increase in one variable corresponds to an increase in another. To quantify this relationship, we can use a method known as least squares regression, which helps determine the best fit line through the data points.
Linear regression, the most common form of regression analysis, models the relationship between two variables with a linear equation of the form:
y = ax + b
In this equation, a represents the slope of the line, and b is the y-intercept. The goal of least squares regression is to minimize the residuals, which are the vertical distances from each data point to the line. A smaller residual indicates a better fit, and the best fit line is achieved when these residuals cannot be minimized further.
To perform least squares regression using a graphing calculator, follow these steps:
- Enable the Diagnostic On feature in the calculator settings.
- Input your data into the calculator, designating one list for x values and another for y values.
- Activate the stat plot feature to visualize the data points on the graph.
- Access the stat menu and select the linear regression option (linReg ax + b), specifying the lists for x and y data.
- Record the output, which will provide the values for a and b, allowing you to write the equation of the best fit line.
- Input this equation into the graphing function of the calculator to visualize the best fit line alongside your data points.
For example, if the output from the calculator gives a = 284 and b = -16,101, the equation of the best fit line would be:
y = 284x - 16,101
By plotting this line, you can visually assess how well it fits the data compared to other lines, such as a red line that may not fit as well. The least squares regression method provides a systematic approach to finding the most accurate representation of the relationship between the variables, enhancing your ability to make predictions based on the data.


