Taxicab fees A taxicab ride costs \$3.50 plus \$2.50 per mile for the first 5 miles, with the rate dropping to \$1.50 per mile after the fifth mile. Let m be the distance (in miles) from the airport to a hotel. Find and graph the piecewise linear function c(m) that represents the cost of taking a taxi from the airport to a hotel m miles away.
Verified step by step guidance
1
Step 1: Understand the problem by identifying the different cost components for the taxi ride. The initial cost is \$3.50, and the cost per mile changes after 5 miles.
Step 2: Define the piecewise function c(m) for the cost. For the first 5 miles, the cost is \$3.50 plus \$2.50 per mile. For distances greater than 5 miles, the cost is \$3.50 plus \$2.50 per mile for the first 5 miles, and \$1.50 per mile for any additional miles.
Step 3: Write the piecewise function c(m). For 0 <= m <= 5, c(m) = 3.50 + 2.50m. For m > 5, c(m) = 3.50 + 2.50*5 + 1.50*(m - 5).
Step 4: Simplify the expression for m > 5. Calculate the cost for the first 5 miles and then add the cost for the additional miles.
Step 5: Graph the piecewise function. Plot the linear segment for 0 <= m <= 5 and the linear segment for m > 5, ensuring continuity at m = 5.
Verified video answer for a similar problem:
This video solution was recommended by our tutors as helpful for the problem above
Video duration:
6m
Play a video:
Was this helpful?
Key Concepts
Here are the essential concepts you must grasp in order to answer the question correctly.
Piecewise Functions
A piecewise function is defined by different expressions based on the input value. In this case, the cost of the taxi ride is determined by the distance traveled, with one rate for the first 5 miles and another for any distance beyond that. Understanding how to construct and interpret piecewise functions is essential for modeling situations where conditions change at specific thresholds.
Linear functions are mathematical expressions that create straight lines when graphed. They are characterized by a constant rate of change, represented by the slope. In the context of the taxi fare, the cost per mile for the first 5 miles and the reduced rate thereafter can be modeled as linear functions, making it crucial to understand their properties for accurate graphing.
Graphing functions involves plotting points on a coordinate system to visually represent the relationship between variables. For the taxi fare, the graph will consist of two linear segments, reflecting the different rates for varying distances. Mastering graphing techniques is vital for interpreting and analyzing the behavior of piecewise functions effectively.

 Verified step by step guidance
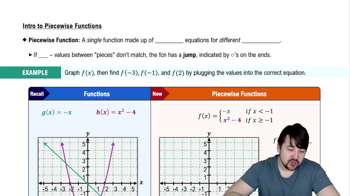
 05:36
05:36