
Ch. 3 - Derivatives
Hass - Thomas' Calculus 15th Edition
Hass15th EditionThomas' CalculusISBN: 9780137616077Not the one you use?Change textbook
Chapter 3, Problem 17d

Understanding Motion from Graphs


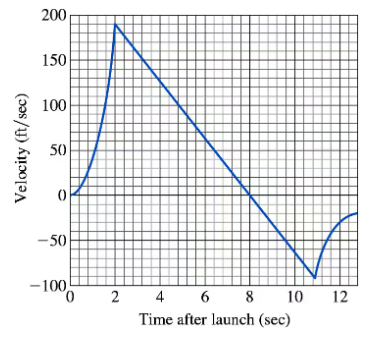
Launching a Rocket When a model rocket is launched, the propellant burns for a few seconds, accelerating the rocket upward. After burnout, the rocket coasts upward for a while and then begins to fall. A small explosive charge pops out a parachute shortly after the rocket starts down. The parachute slows the rocket to keep it from breaking when it lands.


The figure here shows velocity data from the flight of the model rocket. Use the data to answer the following.


d. When did the parachute pop out? How fast was the rocket falling then?


rock4

Verified step by step guidance
1
Examine the graph to understand the velocity changes over time. The graph shows velocity on the y-axis and time on the x-axis.
Identify the point where the velocity changes from negative to positive, indicating the parachute deployment. This is where the rocket's descent slows down.
Locate the time on the x-axis where this change occurs. This is the moment when the parachute pops out.
Determine the velocity at this point by reading the corresponding value on the y-axis. This value represents the speed at which the rocket was falling when the parachute deployed.
Note that the velocity is negative at this point, indicating a downward motion, and the parachute deployment is marked by a sudden change in the slope of the graph.

Verified video answer for a similar problem:

This video solution was recommended by our tutors as helpful for the problem above.
Video duration:
4m
Was this helpful?

Key Concepts

Here are the essential concepts you must grasp in order to answer the question correctly.

Velocity

Velocity is a vector quantity that describes the rate of change of an object's position with respect to time. It includes both speed and direction. In the context of the rocket, the velocity graph shows how fast the rocket is moving upward or downward at any given time, which is crucial for determining when the parachute deploys and the speed of descent.
Recommended video:
06:29
Derivatives Applied To Velocity

Acceleration

Acceleration is the rate of change of velocity over time. It indicates how quickly an object is speeding up or slowing down. In the rocket's flight, acceleration is significant during the burn phase and when the parachute deploys, as it affects the rocket's motion and helps to analyze the changes in velocity shown in the graph.
Recommended video:
06:15
Derivatives Applied To Acceleration

Graph Interpretation

Interpreting graphs involves analyzing the visual representation of data to extract meaningful information. In this case, understanding the velocity-time graph allows us to determine key moments in the rocket's flight, such as when the parachute pops out, by identifying points where the velocity changes from positive to negative, indicating the transition from ascent to descent.
Recommended video:
06:15
Graphing The Derivative
Related Practice
Textbook Question

Understanding Motion from Graphs


Launching a Rocket When a model rocket is launched, the propellant burns for a few seconds, accelerating the rocket upward. After burnout, the rocket coasts upward for a while and then begins to fall. A small explosive charge pops out a parachute shortly after the rocket starts down. The parachute slows the rocket to keep it from breaking when it lands.


The figure here shows velocity data from the flight of the model rocket. Use the data to answer the following.


c. When did the rocket reach its highest point? What was its velocity then?


225
views
Textbook Question

Understanding Motion from Graphs


Launching a Rocket When a model rocket is launched, the propellant burns for a few seconds, accelerating the rocket upward. After burnout, the rocket coasts upward for a while and then begins to fall. A small explosive charge pops out a parachute shortly after the rocket starts down. The parachute slows the rocket to keep it from breaking when it lands.


The figure here shows velocity data from the flight of the model rocket. Use the data to answer the following.


b. For how many seconds did the engine burn?


205
views
Textbook Question

Understanding Motion from Graphs


Launching a Rocket When a model rocket is launched, the propellant burns for a few seconds, accelerating the rocket upward. After burnout, the rocket coasts upward for a while and then begins to fall. A small explosive charge pops out a parachute shortly after the rocket starts down. The parachute slows the rocket to keep it from breaking when it lands.


The figure here shows velocity data from the flight of the model rocket. Use the data to answer the following.


f. When was the rocket’s acceleration greatest?


224
views
Textbook Question

Understanding Motion from Graphs


Launching a Rocket When a model rocket is launched, the propellant burns for a few seconds, accelerating the rocket upward. After burnout, the rocket coasts upward for a while and then begins to fall. A small explosive charge pops out a parachute shortly after the rocket starts down. The parachute slows the rocket to keep it from breaking when it lands.


The figure here shows velocity data from the flight of the model rocket. Use the data to answer the following.


a. How fast was the rocket climbing when the engine stopped?


349
views
Textbook Question

Understanding Motion from Graphs


The accompanying figure shows the velocity v = f(t) of a particle moving on a horizontal coordinate line.


a. When does the particle move forward? Move backward? Speed up? Slow down?

232
views
Textbook Question

Understanding Motion from Graphs


The accompanying figure shows the velocity v = f(t) of a particle moving on a horizontal coordinate line.


b. When is the particle’s acceleration positive? Negative? Zero?

230
views