


 06:15
06:15

Textbook Question
Understanding Motion from Graphs
Launching a Rocket When a model rocket is launched, the propellant burns for a few seconds, accelerating the rocket upward. After burnout, the rocket coasts upward for a while and then begins to fall. A small explosive charge pops out a parachute shortly after the rocket starts down. The parachute slows the rocket to keep it from breaking when it lands.
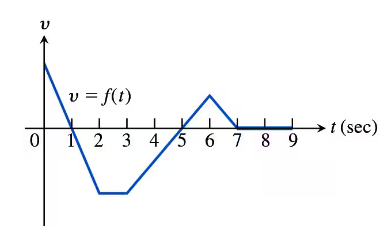
The figure here shows velocity data from the flight of the model rocket. Use the data to answer the following.
d. When did the parachute pop out? How fast was the rocket falling then?
213
views