Ch. 2 - Limits
Briggs - Calculus: Early Transcendentals 3rd Edition
Briggs3rd EditionCalculus: Early TranscendentalsISBN: 9780136847243Not the one you use?Change textbook
Chapter 2, Problem 2.6.77

Find an interval containing a solution to the equation 2x=cos(x)2x=\(\cos\]\left\)(x\(\right\)). Use a graphing utility to approximate the solution.

Verified step by step guidance
1
Insert step 1: Understand the problem. We need to find an interval where the function f(x) = 2x - \(\cos\)(x) changes sign, indicating a root.
Insert step 2: Consider the behavior of the functions involved. The function 2x is a straight line with a slope of 2, and \(\cos\)(x) is a periodic function oscillating between -1 and 1.
Insert step 3: Set up the equation f(x) = 2x - \(\cos\)(x) and analyze its behavior over a reasonable interval, such as [0, \(\pi\)/2], where \(\cos\)(x) is positive and decreasing.
Insert step 4: Use a graphing utility to plot f(x) = 2x - \(\cos\)(x) over the interval [0, \(\pi\)/2] and look for a sign change, which indicates a root.
Insert step 5: Identify the interval where the graph crosses the x-axis, which will give an approximate interval containing the solution.

Verified video answer for a similar problem:

This video solution was recommended by our tutors as helpful for the problem above.
Video duration:
2m
Was this helpful?

Key Concepts

Here are the essential concepts you must grasp in order to answer the question correctly.

Intermediate Value Theorem

The Intermediate Value Theorem states that if a continuous function takes on two values at two points, it must also take on any value between those two points at least once. This theorem is essential for finding intervals where solutions to equations exist, as it guarantees that if the function changes signs over an interval, there is at least one root in that interval.
Recommended video:
05:12
Finding Global Extrema (Extreme Value Theorem)

Graphing Functions

Graphing functions involves plotting the values of a function on a coordinate plane to visualize its behavior. In this context, graphing the functions y = 2x and y = cos(x) allows us to identify points of intersection, which represent the solutions to the equation 2x = cos(x). This visual approach can help approximate the solution and understand the relationship between the two functions.
Recommended video:
5:53
Graph of Sine and Cosine Function

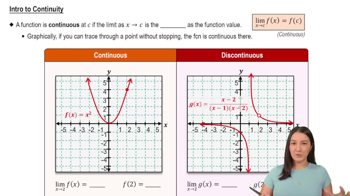
Continuous Functions

A continuous function is one that does not have any breaks, jumps, or holes in its graph. Both y = 2x and y = cos(x) are continuous functions, which is crucial for applying the Intermediate Value Theorem. Understanding continuity helps in determining the behavior of functions and ensuring that solutions can be found within specified intervals.
Recommended video:
05:34
Intro to Continuity