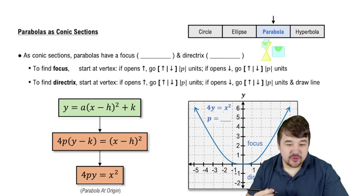
Golden Gate Bridge Completed in 1937, San Francisco’s Golden Gate Bridge is 2.7 km long and weighs about 890,000 tons. The length of the span between the two central towers is 1280 m; the towers themselves extend 152 m above the roadway. The cables that support the deck of the bridge between the two towers hang in a parabola (see figure). Assuming the origin is midway between the towers on the deck of the bridge, find an equation that describes the cables. How long is a guy wire that hangs vertically from the cables to the roadway 500 m from the center of the bridge?
Table of contents
- 0. Functions7h 55m
- Introduction to Functions18m
- Piecewise Functions10m
- Properties of Functions9m
- Common Functions1h 8m
- Transformations5m
- Combining Functions27m
- Exponent rules32m
- Exponential Functions28m
- Logarithmic Functions24m
- Properties of Logarithms36m
- Exponential & Logarithmic Equations35m
- Introduction to Trigonometric Functions38m
- Graphs of Trigonometric Functions44m
- Trigonometric Identities47m
- Inverse Trigonometric Functions48m
- 1. Limits and Continuity2h 2m
- 2. Intro to Derivatives1h 33m
- 3. Techniques of Differentiation3h 18m
- 4. Applications of Derivatives2h 38m
- 5. Graphical Applications of Derivatives6h 2m
- 6. Derivatives of Inverse, Exponential, & Logarithmic Functions2h 37m
- 7. Antiderivatives & Indefinite Integrals1h 26m
- 8. Definite Integrals4h 44m
- 9. Graphical Applications of Integrals2h 27m
- 10. Physics Applications of Integrals 3h 16m
- 11. Integrals of Inverse, Exponential, & Logarithmic Functions2h 31m
- 12. Techniques of Integration7h 41m
- 13. Intro to Differential Equations2h 55m
- 14. Sequences & Series5h 36m
- 15. Power Series2h 19m
- 16. Parametric Equations & Polar Coordinates7h 58m
16. Parametric Equations & Polar Coordinates
Conic Sections
Problem 12.4.65
Textbook Question
63–66. Tracing hyperbolas and parabolas Graph the following equations. Then use arrows and labeled points to indicate how the curve is generated as θ increases from 0 to 2π.
r = 3/(1 - cos θ)
Verified step by step guidance1
Recognize that the given equation \(r = \frac{3}{1 - \cos \theta}\) is a polar equation representing a conic section. Since the denominator is of the form \$1 - e \cos \theta\( with \)e = 1$, this corresponds to a parabola in polar coordinates with the focus at the pole.
Identify the key features of the curve by analyzing the denominator \$1 - \cos \theta\(. Note that when \)\cos \theta\( approaches 1, the denominator approaches zero, causing \)r$ to become very large, indicating a vertical asymptote or a direction where the curve extends to infinity.
Create a table of values for \(\theta\) at important points such as \$0\(, \)\frac{\pi}{2}\(, \)\pi\(, \)\frac{3\pi}{2}\(, and \)2\pi\(. Calculate the corresponding \)r$ values (without final numeric evaluation) to understand the shape and direction of the curve at these angles.
Plot the points \((r, \theta)\) on the polar coordinate plane using the values from the table. Mark these points clearly and draw the curve smoothly through them, keeping in mind the behavior near the asymptote where \(r\) becomes very large.
Add arrows along the curve to indicate the direction of increasing \(\theta\) from \$0\( to \)2\pi\(. Label key points corresponding to the angles used in the table to show how the curve is generated as \)\theta$ increases.
Verified video answer for a similar problem:This video solution was recommended by our tutors as helpful for the problem above
Video duration:
3mPlay a video:
Was this helpful?
Key Concepts
Here are the essential concepts you must grasp in order to answer the question correctly.
Polar Coordinates and Graphing
Polar coordinates represent points using a radius and an angle (r, θ) instead of Cartesian (x, y). Understanding how to plot points by varying θ and calculating r is essential for graphing curves like r = 3/(1 - cos θ). This system is particularly useful for curves with symmetry and periodicity.
Recommended video:
Intro to Polar Coordinates
Conic Sections in Polar Form
Equations like r = 3/(1 - cos θ) describe conic sections (parabolas, hyperbolas, ellipses) in polar form, where the denominator relates to the eccentricity and directrix. Recognizing this form helps identify the curve type and its geometric properties, such as focus and directrix positions.
Recommended video:
Parabolas as Conic Sections
Parametric Tracing and Direction of Curves
Tracing a curve as θ increases involves plotting points sequentially and using arrows to indicate direction. This helps visualize how the curve is generated over the interval 0 to 2π, showing behavior like loops or asymptotes and clarifying the curve’s orientation and shape.
Recommended video:
Differentiation of Parametric Curves
Watch next
Master Geometries from Conic Sections with a bite sized video explanation from Patrick
Start learningRelated Videos
Related Practice
Textbook Question
25
views
