Table of contents
- 1. Introduction to Statistics53m
- 2. Describing Data with Tables and Graphs2h 1m
- 3. Describing Data Numerically2h 8m
- 4. Probability2h 26m
- 5. Binomial Distribution & Discrete Random Variables3h 28m
- 6. Normal Distribution & Continuous Random Variables2h 21m
- 7. Sampling Distributions & Confidence Intervals: Mean3h 37m
- Sampling Distribution of the Sample Mean and Central Limit Theorem19m
- Distribution of Sample Mean - Excel23m
- Introduction to Confidence Intervals22m
- Confidence Intervals for Population Mean1h 26m
- Determining the Minimum Sample Size Required12m
- Finding Probabilities and T Critical Values - Excel28m
- Confidence Intervals for Population Means - Excel25m
- 8. Sampling Distributions & Confidence Intervals: Proportion1h 33m
- 9. Hypothesis Testing for One Sample3h 32m
- 10. Hypothesis Testing for Two Samples4h 49m
- Two Proportions1h 12m
- Two Proportions Hypothesis Test - Excel28m
- Two Means - Unknown, Unequal Variance1h 2m
- Two Means - Unknown Variances Hypothesis Test - Excel12m
- Two Means - Unknown, Equal Variance15m
- Two Means - Unknown, Equal Variances Hypothesis Test - Excel9m
- Two Means - Known Variance12m
- Two Means - Sigma Known Hypothesis Test - Excel21m
- Two Means - Matched Pairs (Dependent Samples)42m
- Matched Pairs Hypothesis Test - Excel12m
- 11. Correlation1h 24m
- 12. Regression1h 59m
- 13. Chi-Square Tests & Goodness of Fit2h 31m
- 14. ANOVA2h 1m
12. Regression
Residuals
Struggling with Statistics for Business?
Join thousands of students who trust us to help them ace their exams!Watch the first videoMultiple Choice
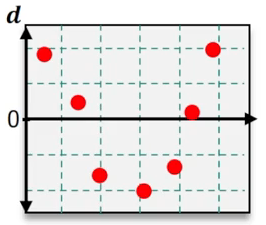
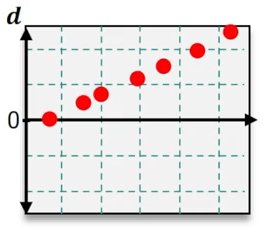
Which of the following residual plots suggest that a linear regression model is appropriate?
A
B
C
D
Verified step by step guidance1
Step 1: Understand the purpose of residual plots in regression analysis. Residual plots are used to assess whether the assumptions of a linear regression model are valid. Specifically, they help determine if the residuals (errors) are randomly distributed and if the relationship between the independent and dependent variables is linear.
Step 2: Examine the residual plots provided. A residual plot that suggests a linear regression model is appropriate will show residuals scattered randomly around the horizontal axis (y = 0) without any discernible pattern.
Step 3: Identify patterns in the residual plots. For example, if the residuals form a curve, trend, or systematic pattern, this indicates that a linear model may not be appropriate. If the residuals are randomly distributed, this supports the use of a linear model.
Step 4: Compare the residual plots. In the images provided, look for the plot where the residuals are evenly scattered around the horizontal axis without forming a trend or systematic pattern.
Step 5: Conclude which residual plot suggests a linear regression model is appropriate based on the analysis. The correct plot will show no curvature, trend, or clustering of residuals, indicating that the linear regression assumptions are satisfied.
Watch next
Master Residuals and Residual Plots with a bite sized video explanation from Patrick
Start learningRelated Videos
0

