13. Chi-Square Tests & Goodness of Fit
Contingency Tables

Multiple Choice
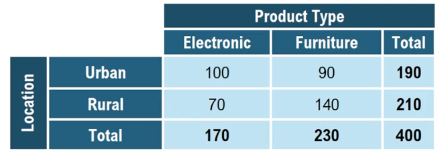
A company wants to understand if the type of product (Electronic vs. Furniture) purchased is associated with the customer's location (Urban vs. Rural). A survey was conducted, and the following data was collected from 400 customers. Calculate the expected frequencies for each cell in the table, assuming the null hypothesis that the type of product purchased and the location of the customer are independent.
A
E1,1 = 100; E2,1 = 100; E1,2 = 100; E2,2 = 1000
B
E1,1 = 42.5; E2,1 = 57.5; E1,2 = 47.5; E2,2 = 52.5
C
E1,1 = 80.75; E2,1 = 89.25; E1,2 = 109.25; E2,2 = 120.75
D
E1,1 = 100; E2,1 =70; E1,2 = 90; E2,2 = 140
 Verified step by step guidance
1
Step 1: Understand the problem. The goal is to calculate the expected frequencies for each cell in the table under the assumption that the type of product purchased and the customer's location are independent. This involves using the formula for expected frequency: E(i,j) = (Row Total * Column Total) / Grand Total.
Step 2: Identify the totals from the table. The row totals are Urban = 190 and Rural = 210. The column totals are Electronic = 170 and Furniture = 230. The grand total is 400.
Step 3: Calculate the expected frequency for the cell (Urban, Electronic). Use the formula: E(Urban, Electronic) = (Row Total for Urban * Column Total for Electronic) / Grand Total. Substituting the values: E(Urban, Electronic) = (190 * 170) / 400.
Step 4: Calculate the expected frequency for the cell (Urban, Furniture). Use the formula: E(Urban, Furniture) = (Row Total for Urban * Column Total for Furniture) / Grand Total. Substituting the values: E(Urban, Furniture) = (190 * 230) / 400.
Step 5: Repeat the process for the Rural row. Calculate E(Rural, Electronic) = (Row Total for Rural * Column Total for Electronic) / Grand Total, and E(Rural, Furniture) = (Row Total for Rural * Column Total for Furniture) / Grand Total.


