Ch. 4 - Applications of Derivatives
Hass - Thomas' Calculus 15th Edition
Hass15th EditionThomas' CalculusISBN: 9780137616077Not the one you use?Change textbook
Chapter 4, Problem 96

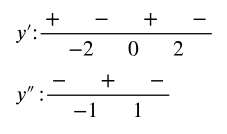
Sketch the graph of a twice-differentiable function y=f(x) that passes through the points (-2,2), (-1,1), (0,0),(1,1), and (2,2) and whose first two derivatives have the following sign patterns.
patt

Verified step by step guidance
1
Identify the intervals where the first derivative y' is positive or negative. The function is increasing where y' is positive and decreasing where y' is negative. From the image, y' is positive on the intervals (-∞, -2), (0, 2) and negative on (-2, 0), (2, ∞).
Identify the intervals where the second derivative y'' is positive or negative. The function is concave up where y'' is positive and concave down where y'' is negative. From the image, y'' is negative on (-∞, -1), (1, ∞) and positive on (-1, 1).
Determine the critical points and inflection points. Critical points occur where y' changes sign, which are at x = -2, 0, and 2. Inflection points occur where y'' changes sign, which are at x = -1 and 1.
Sketch the graph using the information from the derivatives. Start by plotting the given points (-2,2), (-1,1), (0,0), (1,1), and (2,2). Use the sign of y' to determine where the function is increasing or decreasing and the sign of y'' to determine the concavity.
Connect the points smoothly, ensuring that the graph reflects the increasing/decreasing behavior and concavity as determined by the derivatives. The graph should increase from (-∞, -2), decrease from (-2, 0), increase from (0, 2), and decrease from (2, ∞), with concave down sections from (-∞, -1) and (1, ∞), and concave up from (-1, 1).

Verified video answer for a similar problem:

This video solution was recommended by our tutors as helpful for the problem above.
Video duration:
3m
Was this helpful?

Key Concepts

Here are the essential concepts you must grasp in order to answer the question correctly.

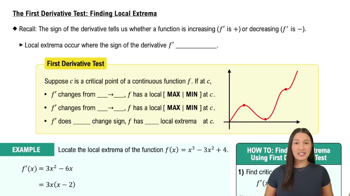
First Derivative Test

The first derivative of a function, denoted as f'(x), indicates the slope of the tangent line at any point on the graph. The sign of the first derivative reveals whether the function is increasing (positive) or decreasing (negative). In this question, the sign pattern of f'(x) helps identify intervals of increase and decrease, which is crucial for sketching the graph.
Recommended video:
07:09
The First Derivative Test: Finding Local Extrema

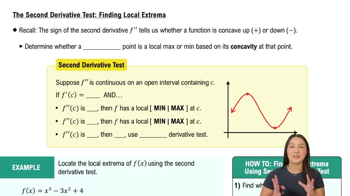
Second Derivative Test

The second derivative, f''(x), provides information about the concavity of the function. If f''(x) is positive, the graph is concave up, while a negative f''(x) indicates concave down. The sign pattern of the second derivative in the question helps determine the nature of critical points and the overall shape of the graph, which is essential for accurate sketching.
Recommended video:
06:02
The Second Derivative Test: Finding Local Extrema

Critical Points and Inflection Points

Critical points occur where the first derivative is zero or undefined, indicating potential local maxima or minima. Inflection points are where the second derivative changes sign, indicating a change in concavity. Understanding these points is vital for sketching the function accurately, as they dictate where the graph changes direction or curvature.
Recommended video:
04:50
Critical Points
Related Practice
Textbook Question

Let ƒ(x) = 3x - x³ . Show that the equation ƒ(𝓍) = -4 has a solution in the interval [2,3] and use Newton’s method to find it.

187
views

Textbook Question

The ladder problem What is the approximate length (in feet) of the longest ladder you can carry horizontally around the corner of the corridor shown here? Round your answer down to the nearest foot.

367
views
Textbook Question

In Exercises 121–124, find the inflection points (if any) on the graph of the function and the coordinates of the points on the graph where the function has a local maximum or local minimum value. Then graph the function in a region large enough to show all these points simultaneously. Add to your picture the graphs of the function’s first and second derivatives. How are the values at which these graphs intersect the x-axis related to the graph of the function? In what other ways are the graphs of the derivatives related to the graph of the function?

123. y=(4/5)x^5+16x^2-25

220
views
Textbook Question

106. Motion Along a Line The graphs in Exercises 105 and 106 show the position s=f(t) of an object moving up and down on a coordinate line. At approximately what times is the (b) velocity equal to zero?

<IMAGE>

241
views
Textbook Question

103. A function f(x) has domain (-2, 2). The graph below is a plot of the derivative of f, not a plot of f itself. In other words, this is a graph of y = f'(x). Either use this graph to determine on which intervals the graph of f is concave up and on which intervals the graph of f is concave down, or explain why this information cannot be determined from the graph.

256
views
Textbook Question

Each of Exercises 89–92 shows the graphs of the first and second derivatives of a function y=f(x). Copy the picture and add to it a sketch of the approximate graph of f, given that the graph passes through the point P.

225
views