Textbook Question
b. Slopes on a tangent curve What is the smallest value the slope of the curve can ever have on the interval −2 < x < 2? Give reasons for your answer.
247
views

 Verified step by step guidance
 04:16
04:16 04:50 04:50
b. Slopes on a tangent curve What is the smallest value the slope of the curve can ever have on the interval −2 < x < 2? Give reasons for your answer.
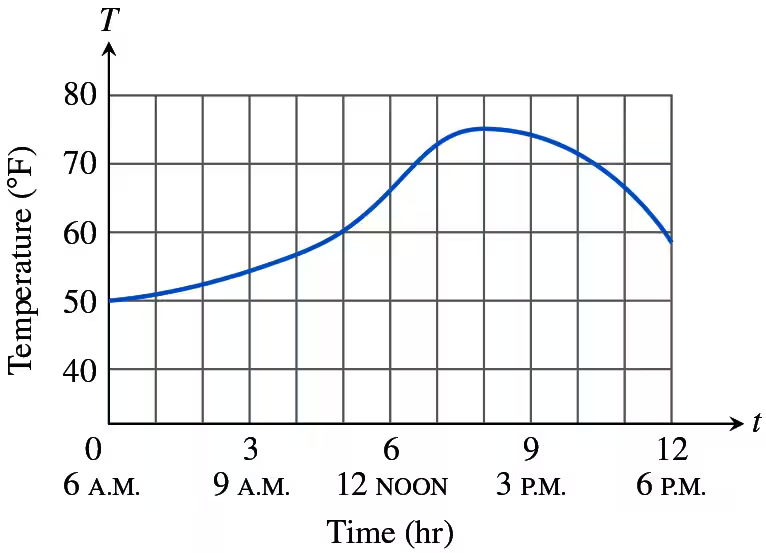
Average single-family home prices P (in thousands of dollars) in Sacramento, California, are shown in the accompanying figure from the beginning of 2006 through the end of 2015.
b. Estimate home prices at the end of
i) 2007 ii) 2012 iii) 2015
Motion Along a Coordinate Line
Exercises 1–6 give the positions s = f(t) of a body moving on a coordinate line, with s in meters and t in seconds.
b. Find the body’s speed and acceleration at the endpoints of the interval.
s = 25/t² − 5/t, 1 ≤ t ≤ 5
Quadratic approximations
b. Find the quadratic approximation to f(x) = 1/(1 − x) at x = 0.
By computing the first few derivatives and looking for a pattern, find the following derivatives.
b. d¹¹⁰/dx¹¹⁰ (sin x − 3 cos x)
Common linear approximations at x = 0 Find the linearizations of the following functions at x = 0.
b. cos x