Find a formula for each function graphed in Exercises 29–32.
b. <IMAGE>
Verified step by step guidance
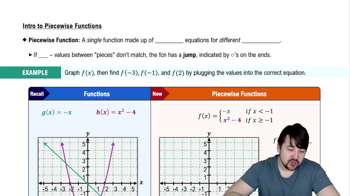
1
Identify the different segments of the graph. A piecewise-defined function is composed of multiple sub-functions, each defined over a specific interval.
Determine the type of function for each segment. Common types include linear, quadratic, or constant functions. Analyze the graph to see if the segments are straight lines, curves, or flat lines.
For each segment, find the equation of the function. If the segment is linear, use the slope-intercept form y = mx + b, where m is the slope and b is the y-intercept. Calculate the slope by using two points on the line.
Define the domain for each piece of the function. The domain is the set of x-values for which each sub-function is applicable. Use the graph to identify the intervals for each segment.
Combine the equations and domains into a piecewise function. Use the format: f(x) = { equation1 for domain1, equation2 for domain2, ... }. Ensure each piece is correctly defined over its respective interval.
Verified video answer for a similar problem:
This video solution was recommended by our tutors as helpful for the problem above
Video duration:
2m
Play a video:
Was this helpful?
Key Concepts
Here are the essential concepts you must grasp in order to answer the question correctly.
Piecewise Functions
Piecewise functions are defined by different expressions based on the input value. They are often used to model situations where a rule changes at certain points, creating distinct segments in the graph. Understanding how to interpret and construct these functions is essential for accurately representing the behavior of the function across its domain.
The domain of a function refers to the set of all possible input values (x-values) for which the function is defined, while the range is the set of all possible output values (y-values). For piecewise functions, identifying the domain and range for each segment is crucial, as it helps in determining the overall behavior of the function and ensures that the correct expressions are applied in their respective intervals.
Interpreting graphs involves analyzing the visual representation of a function to extract key features such as intercepts, slopes, and continuity. For piecewise-defined functions, it is important to recognize how the graph transitions between different segments and to ensure that the mathematical expressions accurately reflect these transitions. This skill is vital for constructing the correct formula based on the graphical information provided.