

Ch. 4 - Applications of Derivatives
Hass - Thomas' Calculus 15th Edition
Hass15th EditionThomas' CalculusISBN: 9780137616077Not the one you use?Change textbook
Chapter 4, Problem 126

Graph f(x) = x cos x and its second derivative together for 0 ≤ x ≤ 2pi. Comment on the behavior of the graph of f in relation to the signs and values of f".

Verified step by step guidance
1
Step 1: Begin by finding the first derivative of the function f(x) = x cos(x). Use the product rule, which states that if you have a function h(x) = u(x)v(x), then h'(x) = u'(x)v(x) + u(x)v'(x). Here, u(x) = x and v(x) = cos(x).
Step 2: Calculate the first derivative f'(x). Using the product rule, differentiate u(x) = x to get u'(x) = 1, and differentiate v(x) = cos(x) to get v'(x) = -sin(x). Therefore, f'(x) = 1 * cos(x) + x * (-sin(x)) = cos(x) - x sin(x).
Step 3: Find the second derivative f''(x) by differentiating f'(x) = cos(x) - x sin(x). Differentiate cos(x) to get -sin(x) and use the product rule on -x sin(x) to get -sin(x) - x cos(x). Thus, f''(x) = -sin(x) - sin(x) - x cos(x) = -2sin(x) - x cos(x).
Step 4: Graph the function f(x) = x cos(x) and its second derivative f''(x) = -2sin(x) - x cos(x) over the interval 0 ≤ x ≤ 2π. Use a graphing tool or software to visualize these functions. Observe the points where the second derivative changes sign, as these indicate potential inflection points where the concavity of f(x) changes.
Step 5: Analyze the behavior of the graph of f(x) in relation to the signs and values of f''(x). When f''(x) > 0, the graph of f(x) is concave up, and when f''(x) < 0, it is concave down. Note how these concavity changes correspond to the shape and turning points of the graph of f(x).

Verified video answer for a similar problem:

This video solution was recommended by our tutors as helpful for the problem above.
Video duration:
2m
Was this helpful?

Key Concepts

Here are the essential concepts you must grasp in order to answer the question correctly.

Graphing Functions

Graphing functions involves plotting the values of a function on a coordinate plane to visualize its behavior over a specified interval. For f(x) = x cos x, this means plotting points for x between 0 and 2π and connecting them smoothly. Understanding the shape and key features of the graph, such as intercepts and turning points, is crucial for analysis.
Recommended video:
5:53
Graph of Sine and Cosine Function

Second Derivative

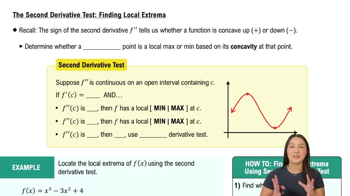
The second derivative of a function, denoted as f''(x), provides information about the concavity of the function's graph. If f''(x) > 0, the graph is concave up, indicating a local minimum, while f''(x) < 0 suggests concave down, indicating a local maximum. Analyzing the second derivative helps in understanding the acceleration of the function's rate of change.
Recommended video:
06:02
The Second Derivative Test: Finding Local Extrema

Behavior of Functions

The behavior of a function refers to how it changes over its domain, including increasing or decreasing trends, and concavity. By examining the signs and values of f(x) and its derivatives, one can infer critical points, inflection points, and overall trends. This analysis is essential for interpreting the relationship between f(x) and its derivatives, especially in the context of graphing.
Recommended video:
5:46
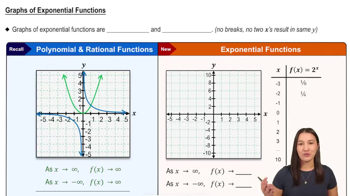
Graphs of Exponential Functions