Ch. 4 - Applications of Derivatives
Hass - Thomas' Calculus 15th Edition
Hass15th EditionThomas' CalculusISBN: 9780137616077Not the one you use?Change textbook
Chapter 4, Problem 68c

Theory and Examples


Sketch the graph of a differentiable function y = f(x) that has a local maxima at (1, 1) and (3, 3)

Verified step by step guidance
1
Step 1: Understand that a local maximum occurs at a point where the function changes from increasing to decreasing. This means the derivative of the function, f'(x), is zero at these points.
Step 2: Identify the given local maxima points: (1, 1) and (3, 3). At these points, the derivative f'(x) should be zero.
Step 3: Consider the behavior of the function around these points. For x < 1, the function should be increasing, and for x > 1, it should be decreasing. Similarly, for x < 3, the function should be increasing, and for x > 3, it should be decreasing.
Step 4: Sketch the graph by plotting the points (1, 1) and (3, 3) on the coordinate plane. Ensure that the curve is smooth and differentiable, meaning there are no sharp corners or discontinuities.
Step 5: Draw the curve such that it rises to the point (1, 1), then falls, rises again to the point (3, 3), and falls again. This will visually represent the local maxima at the specified points.

Verified video answer for a similar problem:

This video solution was recommended by our tutors as helpful for the problem above.
Video duration:
2m
Was this helpful?

Key Concepts

Here are the essential concepts you must grasp in order to answer the question correctly.

Differentiable Function

A differentiable function is one that has a derivative at each point in its domain. This means the function is smooth and continuous, without any sharp corners or cusps. Understanding differentiability is crucial for sketching graphs, as it ensures the function's behavior can be predicted using its derivative.
Recommended video:
05:53
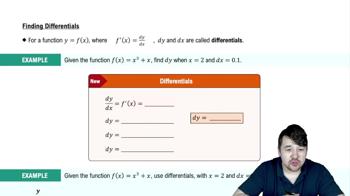
Finding Differentials

Local Maxima

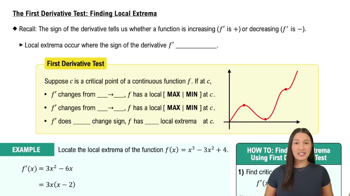
A local maximum of a function occurs at a point where the function value is greater than or equal to the values at nearby points. For a differentiable function, this typically happens where the derivative changes from positive to negative, indicating a peak in the graph. Recognizing local maxima helps in accurately sketching the function's graph.
Recommended video:
07:09
The First Derivative Test: Finding Local Extrema

Graph Sketching

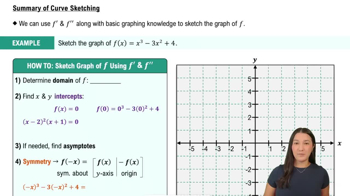
Graph sketching involves plotting the general shape of a function based on its critical points, such as local maxima and minima, and its behavior at infinity. It requires understanding the function's derivative to determine where the function is increasing or decreasing, and how it curves, to accurately represent the function's behavior visually.
Recommended video:
11:41
Summary of Curve Sketching