The slope of a line is a fundamental concept in understanding the characteristics of linear equations. Represented by the letter m, the slope measures the steepness or incline of a line. It is calculated by dividing the vertical change, known as the rise, by the horizontal change, called the run. This relationship can be expressed simply as slope = rise/run.
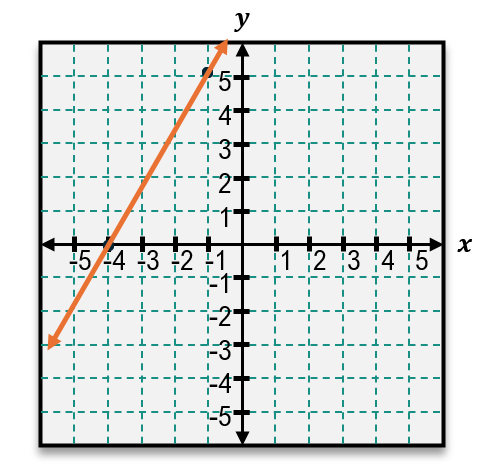
When given a graph, the slope can be found by identifying two points on the line and counting the units moved vertically and horizontally between them. For example, if the line rises 3 units and runs 1 unit to the right, the slope is 3/1, which equals 3. This indicates a relatively steep line.
More formally, the slope is calculated using the coordinates of two points, (x₁, y₁) and (x₂, y₂), on the line. The formula for slope is:
\[m = \frac{y_2 - y_1}{x_2 - x_1}\]
Here, the numerator represents the change in the y-values (rise), and the denominator represents the change in the x-values (run). The symbol Δ (delta) is often used to denote change, so slope can also be written as:
\[m = \frac{\Delta y}{\Delta x}\]
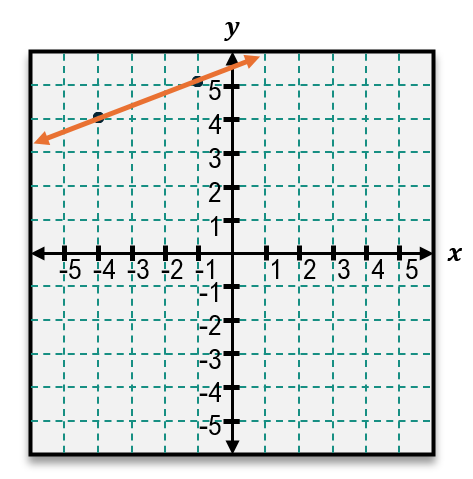
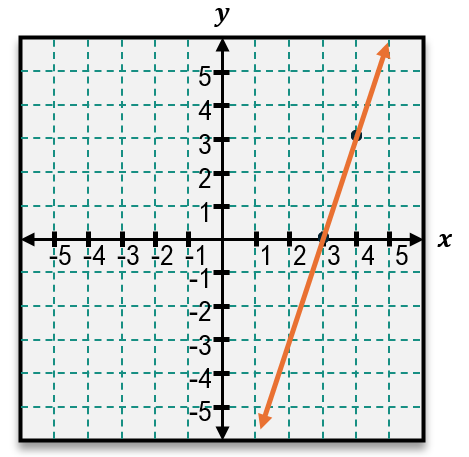
For instance, if the points are (-1, 0) and (0, 3), the slope calculation would be:
\[m = \frac{3 - 0}{0 - (-1)} = \frac{3}{1} = 3\]
It is important to note that the order of subtraction must be consistent; however, it does not matter which point is chosen as the first or second, as long as the same order is used for both numerator and denominator.
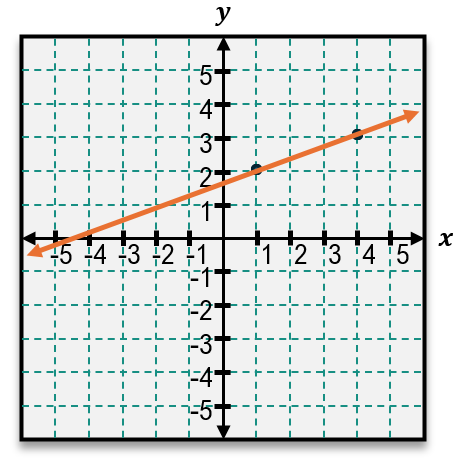
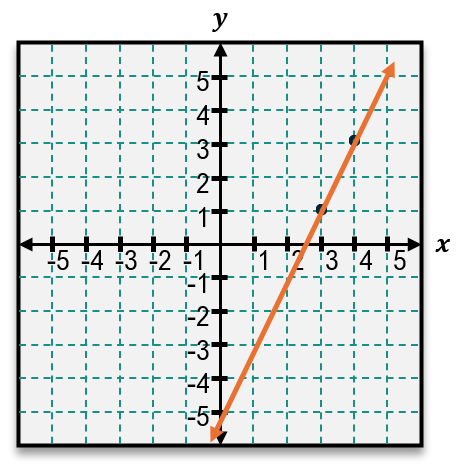
When only two points are given without a graph, the same formula applies. For example, given points (1, 2) and (4, 5), the slope is:
\[m = \frac{5 - 2}{4 - 1} = \frac{3}{3} = 1\]
This slope of 1 indicates a less steep line compared to a slope of 3. Understanding how to calculate slope from either a graph or coordinate points is essential for analyzing linear relationships and predicting behavior of lines in various contexts.