


Textbook Question
Finding the Best Model
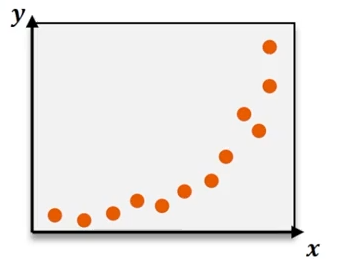
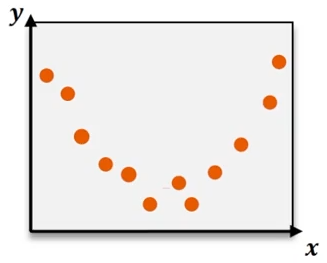
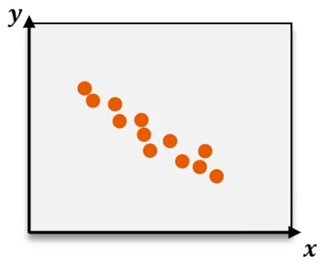
In Exercises 5–16, construct a scatterplot and identify the mathematical model that best fits the given data. Assume that the model is to be used only for the scope of the given data, and consider only linear, quadratic, logarithmic, exponential, and power models.
Population Growth Here are the values of the world population (billions) beginning with the year 2000:
22
views

