A city government claims that no more than of households have solar panels. A researcher suspects the rate is actually higher and surveys households, finding that have solar panels. Test if there is evidence that more than of households have solar panels using .
Table of contents
- 1. Introduction to Statistics53m
- 2. Describing Data with Tables and Graphs2h 1m
- 3. Describing Data Numerically2h 8m
- 4. Probability2h 26m
- 5. Binomial Distribution & Discrete Random Variables3h 28m
- 6. Normal Distribution & Continuous Random Variables2h 21m
- 7. Sampling Distributions & Confidence Intervals: Mean3h 37m
- Sampling Distribution of the Sample Mean and Central Limit Theorem19m
- Distribution of Sample Mean - Excel23m
- Introduction to Confidence Intervals22m
- Confidence Intervals for Population Mean1h 26m
- Determining the Minimum Sample Size Required12m
- Finding Probabilities and T Critical Values - Excel28m
- Confidence Intervals for Population Means - Excel25m
- 8. Sampling Distributions & Confidence Intervals: Proportion2h 20m
- 9. Hypothesis Testing for One Sample5h 15m
- Steps in Hypothesis Testing1h 13m
- Performing Hypothesis Tests: Means1h 1m
- Hypothesis Testing: Means - Excel42m
- Performing Hypothesis Tests: Proportions39m
- Hypothesis Testing: Proportions - Excel27m
- Performing Hypothesis Tests: Variance12m
- Critical Values and Rejection Regions29m
- Link Between Confidence Intervals and Hypothesis Testing12m
- Type I & Type II Errors16m
- 10. Hypothesis Testing for Two Samples5h 35m
- Two Proportions1h 12m
- Two Proportions Hypothesis Test - Excel28m
- Two Means - Unknown, Unequal Variance1h 2m
- Two Means - Unknown Variances Hypothesis Test - Excel12m
- Two Means - Unknown, Equal Variance15m
- Two Means - Unknown, Equal Variances Hypothesis Test - Excel9m
- Two Means - Known Variance12m
- Two Means - Sigma Known Hypothesis Test - Excel21m
- Two Means - Matched Pairs (Dependent Samples)42m
- Matched Pairs Hypothesis Test - Excel12m
- Two Variances and F Distribution29m
- Two Variances - Graphing Calculator15m
- 11. Correlation1h 24m
- 12. Regression3h 42m
- Linear Regression & Least Squares Method26m
- Residuals12m
- Coefficient of Determination12m
- Regression Line Equation and Coefficient of Determination - Excel8m
- Finding Residuals and Creating Residual Plots - Excel11m
- Inferences for Slope32m
- Enabling Data Analysis Toolpak1m
- Regression Readout of the Data Analysis Toolpak - Excel21m
- Prediction Intervals13m
- Prediction Intervals - Excel19m
- Multiple Regression - Excel29m
- Quadratic Regression23m
- Quadratic Regression - Excel10m
- 13. Chi-Square Tests & Goodness of Fit2h 31m
- 14. ANOVA2h 32m
9. Hypothesis Testing for One Sample
Performing Hypothesis Tests: Proportions
Struggling with Statistics for Business?
Join thousands of students who trust us to help them ace their exams!Watch the first videoMultiple Choice
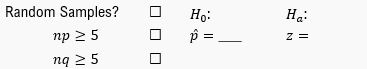
Perform a 2-tailed hypothesis test for the true proportion of successes using the given values:
, , , & claim is

A
Because P-value = 0.00004 < α= 0.01, we FAIL TO REJECT H0. There is NOT ENOUGH evidence to suggest Ha: p ≠ 0.75
B
Because P-value = 0.00004 < α= 0.01, we REJECT H0. There is ENOUGH evidence to suggest Ha: p ≠ 0.75
C
Because P-value = 0.00008 < α= 0.01, we REJECT H0. There is ENOUGH evidence to suggest Ha: p ≠ 0.75
D
Because P-value = 0.00008 < α= 0.01, we FAIL TO REJECT H0. There is NOT ENOUGH evidence to suggest Ha: p ≠ 0.75
0 Comments
Verified step by step guidance1
Step 1: Define the null hypothesis (H₀) and the alternative hypothesis (Hₐ). The null hypothesis typically states that the population proportion is equal to the claimed value (p = 0.25). The alternative hypothesis for a two-tailed test states that the population proportion is not equal to the claimed value (p ≠ 0.25).
Step 2: Calculate the sample proportion (p̂). The sample proportion is given by the formula p̂ = x / n, where x is the number of successes (42) and n is the sample size (100).
Step 3: Verify the conditions for performing the hypothesis test. Ensure that the sample size is large enough by checking that np ≥ 5 and nq ≥ 5, where q = 1 - p. For this problem, calculate np = n * p and nq = n * q.
Step 4: Compute the test statistic (z). Use the formula z = (p̂ - p) / √(p * q / n), where p̂ is the sample proportion, p is the claimed proportion, q = 1 - p, and n is the sample size.
Step 5: Compare the calculated z-value to the critical z-value for a two-tailed test at α = 0.10. Alternatively, calculate the p-value and compare it to α. If the p-value is less than α, reject the null hypothesis; otherwise, fail to reject the null hypothesis.
Watch next
Master Performing Hypothesis Tests: Proportions with a bite sized video explanation from Patrick
Start learningRelated Videos
Related Practice
Multiple Choice
Performing Hypothesis Tests: Proportions practice set

