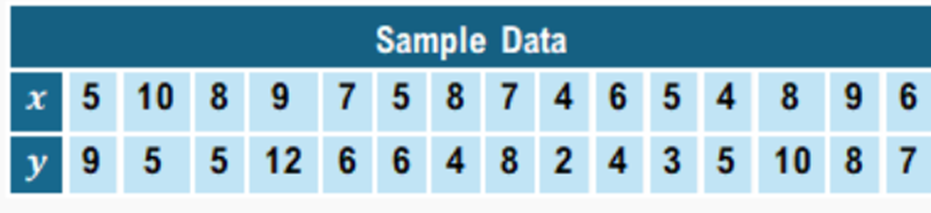
Using the sample data below, create a confidence interval for to see if there is evidence that there is a positive correlation between and with .
Table of contents
- 1. Introduction to Statistics53m
- 2. Describing Data with Tables and Graphs2h 1m
- 3. Describing Data Numerically2h 8m
- 4. Probability2h 26m
- 5. Binomial Distribution & Discrete Random Variables3h 28m
- 6. Normal Distribution & Continuous Random Variables2h 21m
- 7. Sampling Distributions & Confidence Intervals: Mean3h 37m
- Sampling Distribution of the Sample Mean and Central Limit Theorem19m
- Distribution of Sample Mean - Excel23m
- Introduction to Confidence Intervals22m
- Confidence Intervals for Population Mean1h 26m
- Determining the Minimum Sample Size Required12m
- Finding Probabilities and T Critical Values - Excel28m
- Confidence Intervals for Population Means - Excel25m
- 8. Sampling Distributions & Confidence Intervals: Proportion1h 33m
- 9. Hypothesis Testing for One Sample3h 32m
- 10. Hypothesis Testing for Two Samples4h 49m
- Two Proportions1h 12m
- Two Proportions Hypothesis Test - Excel28m
- Two Means - Unknown, Unequal Variance1h 2m
- Two Means - Unknown Variances Hypothesis Test - Excel12m
- Two Means - Unknown, Equal Variance15m
- Two Means - Unknown, Equal Variances Hypothesis Test - Excel9m
- Two Means - Known Variance12m
- Two Means - Sigma Known Hypothesis Test - Excel21m
- Two Means - Matched Pairs (Dependent Samples)42m
- Matched Pairs Hypothesis Test - Excel12m
- 11. Correlation1h 24m
- 12. Regression1h 59m
- 13. Chi-Square Tests & Goodness of Fit2h 31m
- 14. ANOVA2h 1m
12. Regression
Inferences for Slope
Struggling with Statistics for Business?
Join thousands of students who trust us to help them ace their exams!Watch the first videoMultiple Choice
Using the sample data below, run a hypothesis test on to see if there is evidence that there is a positive correlation between and with .

A
Reject H0 and conclude that there is a positive correlation between x and y and that β>0.
B
Fail to reject H0 since there is enough evidence to suggest β>0, but not enough evidence to suggest positive linear correlation between x and y.
C
Fail to reject H0 since there is not enough evidence to suggest β>0 and not enough evidence to suggest positive linear correlation between x and y.
D
Reject H0 since there is not enough evidence to suggest β>0 and not enough evidence to suggest positive linear correlation between x and y.
Verified step by step guidance1
Step 1: Define the hypotheses for the test. The null hypothesis (\(H_0\)) states that there is no positive correlation between \(x\) and \(y\), which means \(\beta \leq 0\). The alternative hypothesis (\(H_a\)) states that there is a positive correlation, so \(\beta > 0\).
Step 2: Calculate the sample correlation coefficient \(r\) between the paired \(x\) and \(y\) values using the formula:
\[r = \frac{n\sum xy - \sum x \sum y}{\sqrt{(n\sum x^2 - (\sum x)^2)(n\sum y^2 - (\sum y)^2)}}\]
where \(n\) is the number of pairs.
Step 3: Compute the test statistic \(t\) for the correlation using the formula:
\[t = \frac{r\sqrt{n-2}}{\sqrt{1-r^2}}\]
This follows a \(t\)-distribution with \(n-2\) degrees of freedom.
Step 4: Determine the critical value from the \(t\)-distribution for a one-tailed test at the significance level \(\alpha = 0.01\) with \(n-2\) degrees of freedom.
Step 5: Compare the calculated test statistic \(t\) to the critical value. If \(t\) is greater than the critical value, reject \(H_0\) and conclude there is evidence of a positive correlation. Otherwise, fail to reject \(H_0\), indicating insufficient evidence to support a positive correlation between \(x\) and \(y\).
Watch next
Master Hypothesis Test for the Slope of a Regression Line with a bite sized video explanation from Patrick
Start learningRelated Videos
Related Practice
Inferences for Slope practice set

