Ch. 1 - Functions
Hass - Thomas' Calculus 15th Edition
Hass15th EditionThomas' CalculusISBN: 9780137616077Not the one you use?Change textbook
Chapter 1, Problem 1.4.35

Use graphing software to graph the functions specified in Exercises 31–36.
Select a viewing window that reveals the key features of the function.


Graph the function f (x) = sin 2x + cos 3x.

Verified step by step guidance
1
Step 1: Understand the function f(x) = sin(2x) + cos(3x). This is a combination of two trigonometric functions, where sin(2x) oscillates with a frequency determined by the coefficient 2, and cos(3x) oscillates with a frequency determined by the coefficient 3. The sum of these functions creates a more complex waveform.
Step 2: Choose an appropriate graphing software or tool, such as Desmos, GeoGebra, or a graphing calculator. These tools allow you to input the function and adjust the viewing window to observe its behavior.
Step 3: Input the function f(x) = sin(2x) + cos(3x) into the graphing software. Ensure that the syntax matches the software's requirements (e.g., use 'sin(2x)' and 'cos(3x)' directly).
Step 4: Select a viewing window that reveals the key features of the function. For trigonometric functions, a good starting point is to set the x-axis range from -2π to 2π (or -6.28 to 6.28) to capture at least one full period of oscillation. Adjust the y-axis range to accommodate the amplitude of the function, which is determined by the sum of the maximum values of sin(2x) and cos(3x).
Step 5: Analyze the graph. Look for key features such as the amplitude, frequency, and points of intersection between sin(2x) and cos(3x). Observe how the combination of these functions creates a unique waveform and note any symmetry or periodicity in the graph.

Verified video answer for a similar problem:

This video solution was recommended by our tutors as helpful for the problem above.
Video duration:
9m
Was this helpful?

Key Concepts

Here are the essential concepts you must grasp in order to answer the question correctly.

Trigonometric Functions

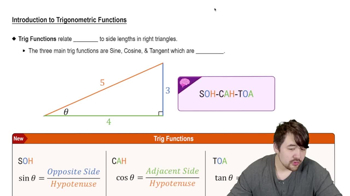
Trigonometric functions, such as sine and cosine, are fundamental periodic functions that describe relationships between angles and sides in triangles. The sine function, sin(x), represents the y-coordinate of a point on the unit circle, while the cosine function, cos(x), represents the x-coordinate. Understanding their properties, including amplitude, period, and phase shift, is essential for analyzing and graphing their combinations.
Recommended video:
6:04
Introduction to Trigonometric Functions

Graphing Functions

Graphing functions involves plotting points on a coordinate system to visualize the relationship between the input (x-values) and output (f(x) values). For trigonometric functions, this includes identifying key features such as intercepts, maxima, minima, and periodicity. Using graphing software allows for precise representation and manipulation of these functions, making it easier to observe their behavior over specified intervals.
Recommended video:
5:53
Graph of Sine and Cosine Function

Viewing Window

The viewing window in graphing software defines the range of x and y values displayed on the graph. Selecting an appropriate viewing window is crucial for revealing key features of the function, such as peaks, troughs, and periodicity. A well-chosen window allows for a comprehensive understanding of the function's behavior, ensuring that important characteristics are not overlooked.
Recommended video:
13:49
Example 4: Norman Window