The graph of a circle represents all points equidistant from a fixed point called the center. This fixed distance is known as the radius, typically denoted by r. The center of the circle is given by the ordered pair (h, k), which locates the circle on the coordinate plane. The standard form equation of a circle is expressed as:
\[ (x - h)^2 + (y - k)^2 = r^2 \]
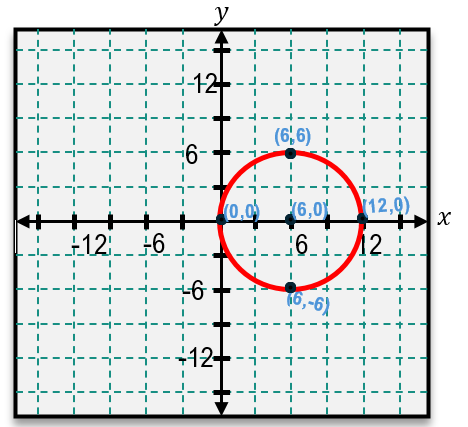
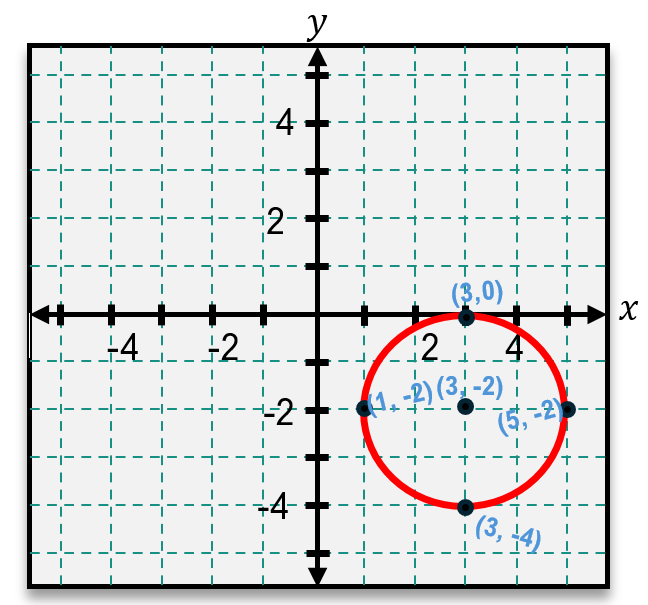
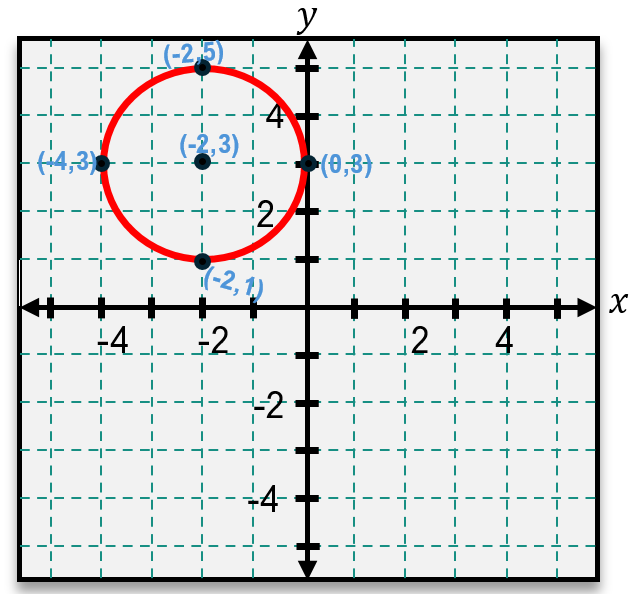
Here, h and k represent the x- and y-coordinates of the center, respectively, while r is the radius. To graph a circle from this equation, first identify the center by interpreting the values of h and k. For example, if the equation contains (x - 2)^2, then h = 2. If it contains (y + 1)^2, remember that this corresponds to y - (-1), so k = -1. The radius is the square root of the constant on the right side of the equation. For instance, if the equation equals 16, then the radius is r = 4 because \(16 = 4^2\).
Once the center and radius are determined, plot the center point on the coordinate plane. From this center, measure the radius length up, down, left, and right to mark four key points. Connecting these points smoothly forms the circle.
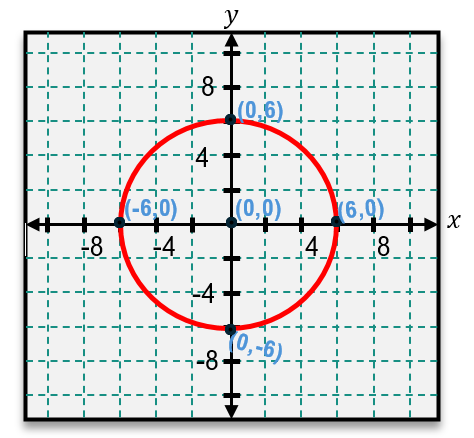
In cases where the circle is centered at the origin (0, 0), the equation simplifies to:
\[ x^2 + y^2 = r^2 \]
This is a special case of the standard form where h = 0 and k = 0, so the terms involving h and k are omitted. Recognizing this form helps quickly identify circles centered at the origin.
Understanding how to interpret and graph circles from their standard form equations is essential for visualizing geometric relationships and solving problems involving circular shapes on the coordinate plane.