Graphing a system of linear inequalities involves combining the concepts of graphing individual inequalities and identifying their overlapping solution regions. Unlike systems of linear equations, which can be solved algebraically, systems of inequalities are typically solved by graphing each inequality and shading the appropriate regions to find where all conditions are simultaneously satisfied.
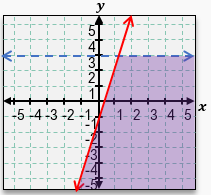
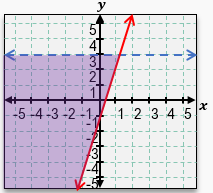
To graph a system of inequalities, start by treating each inequality as an equation by replacing the inequality symbol with an equals sign. For example, consider the inequality \(y \leq -x + 4\). This is already in slope-intercept form, where the slope is \(-1\) and the y-intercept is \(4\). Plot the line by marking the y-intercept at \((0,4)\) and using the slope to find additional points, such as moving down 1 unit and right 1 unit. Since the inequality includes "less than or equal to," draw a solid line to indicate that points on the line satisfy the inequality.
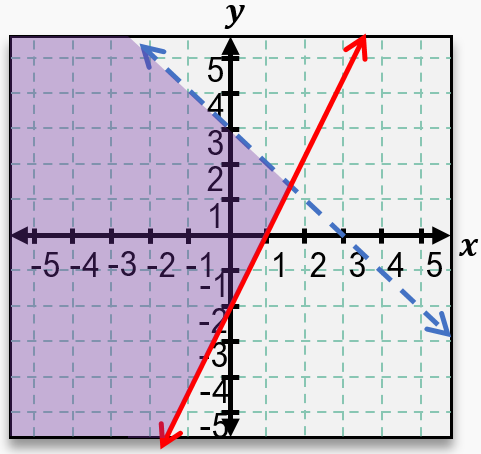
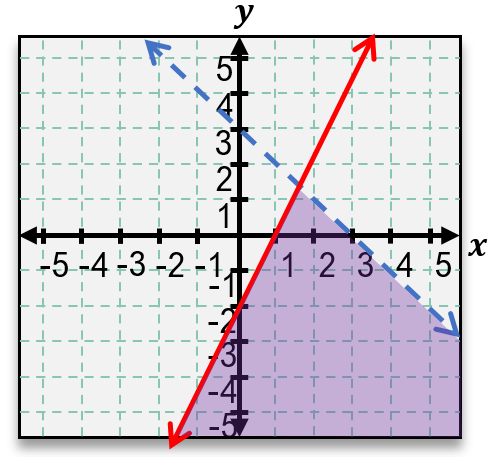
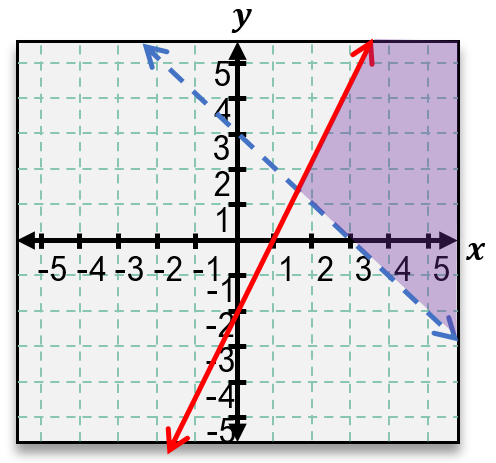
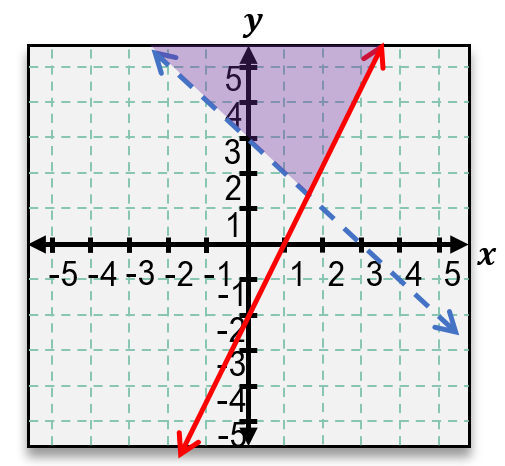
Next, determine which side of the line to shade. Use a test point not on the line, commonly \((0,0)\) if it is not on the line, and substitute its coordinates into the inequality. For \(y \leq -x + 4\), substituting \((0,0)\) gives \(0 \leq 0 + 4\), which is true. Therefore, shade the side of the line that contains \((0,0)\), representing all points that satisfy the inequality.
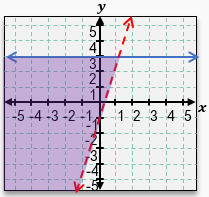
Repeat this process for the second inequality, such as \(y > 2x + 1\). Graph the line \(y = 2x + 1\) by plotting the y-intercept at \((0,1)\) and using the slope \(2\) (rise over run: 2 up, 1 right) to find additional points. Since the inequality is strictly greater than, draw a dashed line to indicate points on the line are not included in the solution. Test the point \((0,0)\) by substituting into the inequality: \(0 > 2(0) + 1\) simplifies to \(0 > 1\), which is false. Therefore, shade the side of the line opposite to \((0,0)\), representing all points where \(y\) is greater than \(2x + 1\).
After graphing and shading each inequality with distinct colors or patterns, identify the overlapping region where the shaded areas intersect. This overlapping region represents the solution set to the system of inequalities, containing all points that satisfy every inequality simultaneously. If no such overlapping region exists, the system has no solution.
This method emphasizes understanding the graphical representation of inequalities, the significance of solid versus dashed boundary lines, and the use of test points to determine shading direction. Mastery of these concepts enables accurate visualization and solution of systems of linear inequalities.