Table of contents
- 1. Introduction to Statistics53m
- 2. Describing Data with Tables and Graphs2h 1m
- 3. Describing Data Numerically2h 8m
- 4. Probability2h 26m
- 5. Binomial Distribution & Discrete Random Variables3h 28m
- 6. Normal Distribution & Continuous Random Variables2h 21m
- 7. Sampling Distributions & Confidence Intervals: Mean3h 37m
- Sampling Distribution of the Sample Mean and Central Limit Theorem19m
- Distribution of Sample Mean - Excel23m
- Introduction to Confidence Intervals22m
- Confidence Intervals for Population Mean1h 26m
- Determining the Minimum Sample Size Required12m
- Finding Probabilities and T Critical Values - Excel28m
- Confidence Intervals for Population Means - Excel25m
- 8. Sampling Distributions & Confidence Intervals: Proportion1h 33m
- 9. Hypothesis Testing for One Sample3h 32m
- 10. Hypothesis Testing for Two Samples4h 49m
- Two Proportions1h 12m
- Two Proportions Hypothesis Test - Excel28m
- Two Means - Unknown, Unequal Variance1h 2m
- Two Means - Unknown Variances Hypothesis Test - Excel12m
- Two Means - Unknown, Equal Variance15m
- Two Means - Unknown, Equal Variances Hypothesis Test - Excel9m
- Two Means - Known Variance12m
- Two Means - Sigma Known Hypothesis Test - Excel21m
- Two Means - Matched Pairs (Dependent Samples)42m
- Matched Pairs Hypothesis Test - Excel12m
- 11. Correlation1h 24m
- 12. Regression1h 59m
- 13. Chi-Square Tests & Goodness of Fit2h 31m
- 14. ANOVA2h 1m
2. Describing Data with Tables and Graphs
Pie Charts
Struggling with Statistics for Business?
Join thousands of students who trust us to help them ace their exams!Watch the first videoMultiple Choice
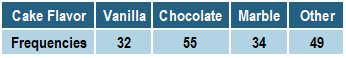
A student wants to use the table to create a pie chart demonstrating the cake preferences of their classmates. Find the percent of students who prefer vanilla cake.

A
B
C
D
Verified step by step guidance1
Step 1: Identify the total number of students surveyed by summing up the frequencies for all cake flavors. Add the values: 32 (Vanilla) + 55 (Chocolate) + 34 (Marble) + 49 (Other).
Step 2: Calculate the proportion of students who prefer vanilla cake by dividing the frequency of vanilla cake (32) by the total number of students obtained in Step 1.
Step 3: Convert the proportion obtained in Step 2 into a percentage by multiplying it by 100. Use the formula: \( \text{Percentage} = \left( \frac{\text{Frequency of Vanilla}}{\text{Total Frequency}} \right) \times 100 \).
Step 4: Round the percentage to one decimal place if necessary, as pie chart percentages are typically rounded for clarity.
Step 5: Use the calculated percentage to create the pie chart segment for vanilla cake preferences, ensuring the total percentages for all flavors add up to 100%.
Related Videos
0

