3. Describing Data Numerically
Percentiles & Quartiles

Multiple Choice
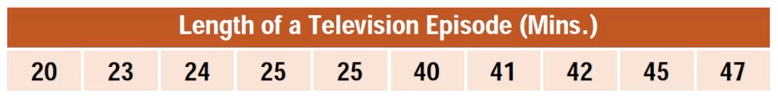
Using the data in the table below, compute Q1 and Q3.
A
&
B
&
C
&
D
&
 Verified step by step guidance
1
Step 1: Organize the data in ascending order. The table already provides the data sorted in ascending order, which is helpful for calculating percentiles and quartiles.
Step 2: To find P50 (the median), locate the middle value of the dataset. Since there are 30 values in total, the median will be the average of the 15th and 16th values in the ordered dataset.
Step 3: To determine the percentile rank of a playlist with 15 songs, use the formula: Percentile Rank = ((Number of values below the given value) / Total number of values) × 100. Count the number of values below 15 in the dataset and apply the formula.
Step 4: To find Q1 (the first quartile), locate the value at the 25th percentile. This corresponds to the value at the position (n+1)/4 in the ordered dataset, where n is the total number of values.
Step 5: To find Q3 (the third quartile), locate the value at the 75th percentile. This corresponds to the value at the position 3(n+1)/4 in the ordered dataset, where n is the total number of values.


