Shade the area corresponding to the probability listed, then find the probability.
Table of contents
- 1. Introduction to Statistics53m
- 2. Describing Data with Tables and Graphs2h 1m
- 3. Describing Data Numerically2h 8m
- 4. Probability2h 26m
- 5. Binomial Distribution & Discrete Random Variables3h 28m
- 6. Normal Distribution & Continuous Random Variables2h 21m
- 7. Sampling Distributions & Confidence Intervals: Mean3h 37m
- Sampling Distribution of the Sample Mean and Central Limit Theorem19m
- Distribution of Sample Mean - Excel23m
- Introduction to Confidence Intervals22m
- Confidence Intervals for Population Mean1h 26m
- Determining the Minimum Sample Size Required12m
- Finding Probabilities and T Critical Values - Excel28m
- Confidence Intervals for Population Means - Excel25m
- 8. Sampling Distributions & Confidence Intervals: Proportion1h 33m
- 9. Hypothesis Testing for One Sample3h 32m
- 10. Hypothesis Testing for Two Samples4h 49m
- Two Proportions1h 12m
- Two Proportions Hypothesis Test - Excel28m
- Two Means - Unknown, Unequal Variance1h 2m
- Two Means - Unknown Variances Hypothesis Test - Excel12m
- Two Means - Unknown, Equal Variance15m
- Two Means - Unknown, Equal Variances Hypothesis Test - Excel9m
- Two Means - Known Variance12m
- Two Means - Sigma Known Hypothesis Test - Excel21m
- Two Means - Matched Pairs (Dependent Samples)42m
- Matched Pairs Hypothesis Test - Excel12m
- 11. Correlation1h 24m
- 12. Regression1h 59m
- 13. Chi-Square Tests & Goodness of Fit2h 31m
- 14. ANOVA2h 1m
6. Normal Distribution & Continuous Random Variables
Uniform Distribution
Struggling with Statistics for Business?
Join thousands of students who trust us to help them ace their exams!Watch the first videoMultiple Choice
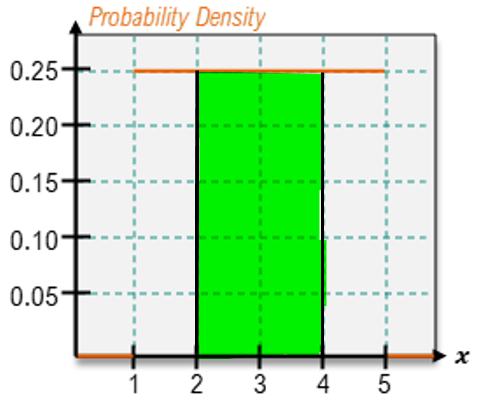
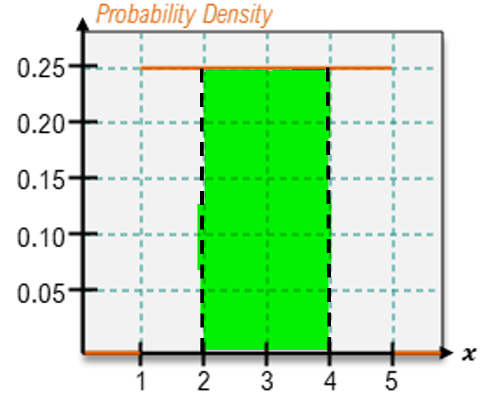
Shade the area corresponding to the probability listed, then find the probability.
P(2<X<4)
A
; P(2<X<4)=0.25
B
; P(2<X<4)=0.25
C
; P(2<X<4)=0.5
D
; P(2<X<4)=0.5
Verified step by step guidance1
Step 1: Identify the type of probability distribution represented in the graph. The graph shows a uniform probability density function, where the probability density is constant (0.25) across the range of x values from 1 to 5.
Step 2: Understand the problem. The goal is to calculate the probability for the interval P(2 < X < 4). This corresponds to the shaded green area in the graph between x = 2 and x = 4.
Step 3: Recall the formula for calculating probabilities in a uniform distribution. The probability is equal to the area under the curve within the specified interval. For a uniform distribution, the area is calculated as the product of the height of the probability density function and the width of the interval.
Step 4: Determine the width of the interval. The interval is from x = 2 to x = 4, so the width is 4 - 2 = 2.
Step 5: Multiply the width of the interval by the height of the probability density function. The height is given as 0.25, so the probability is calculated as 0.25 × 2. This gives the probability for P(2 < X < 4).
Watch next
Master Uniform Distribution with a bite sized video explanation from Patrick
Start learningRelated Videos
Related Practice
Multiple Choice
Uniform Distribution practice set

