Join thousands of students who trust us to help them ace their exams!
Multiple Choice
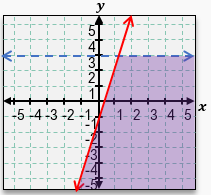
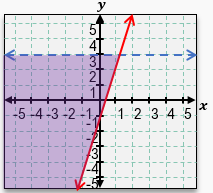
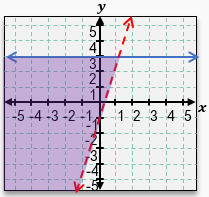
Which of the following graphs accurately represents the solution to the system of inequalities?
A
B
C
0 Comments
Verified step by step guidance
1
Step 1: Identify the inequalities given: \(y \geq 3x - 1\) and \(y < 3\).
Step 2: For \(y \geq 3x - 1\), the boundary line is \(y = 3x - 1\). Since the inequality is \(\geq\), the region above or on this line is shaded.
Step 3: For \(y < 3\), the boundary line is \(y = 3\). Since the inequality is strictly less than, the region below this horizontal line is shaded, and the line itself is not included (dashed line).
Step 4: The solution to the system is the intersection of the two shaded regions: above or on the line \(y = 3x - 1\) and below the line \(y = 3\).
Step 5: Examine the graphs to find the one where the region above the red line \(y = 3x - 1\) is shaded and also below the blue dashed line \(y = 3\) is shaded, with the correct boundary line styles (solid for \(\geq\), dashed for \(<\)).


 Verified step by step guidance