Join thousands of students who trust us to help them ace their exams!
Multiple Choice
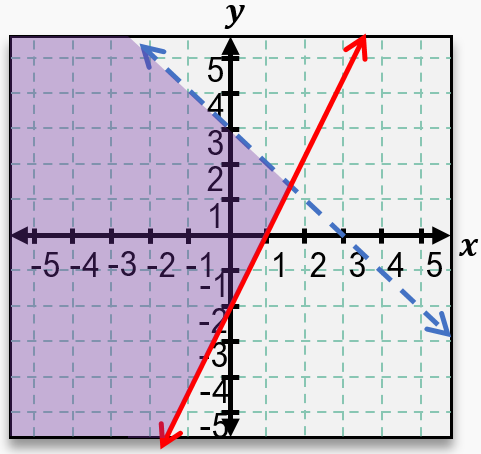
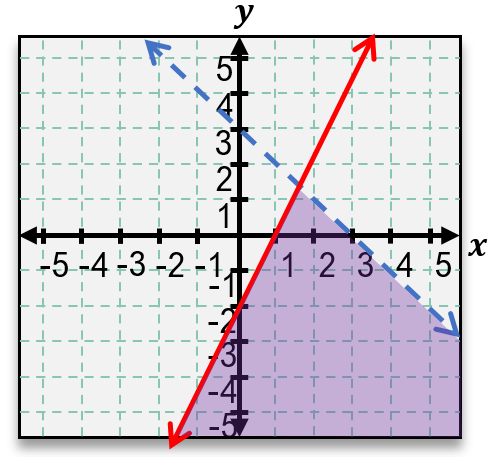
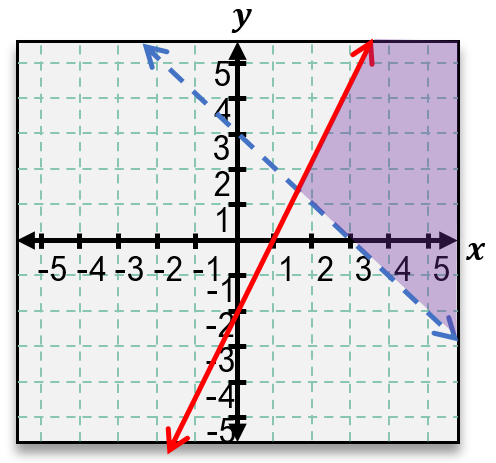
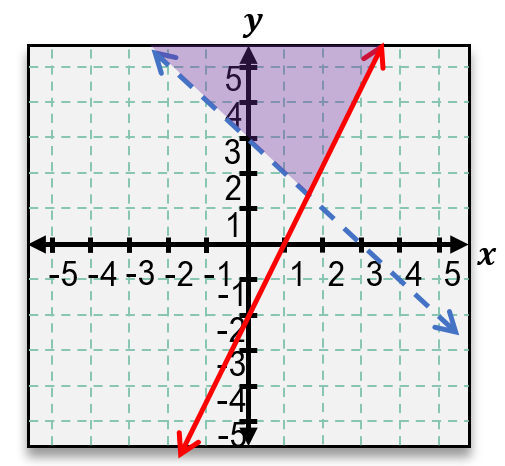
Graph the system of inequalities and indicate the region (if any) of solutions satisfying all equations.
A
B
C
D
0 Comments
Verified step by step guidance
1
Step 1: Identify the inequalities to graph: \(y \geq 2x - 2\) and \(y > 3 - x\).
Step 2: Graph the boundary lines for each inequality. For \(y \geq 2x - 2\), graph the line \(y = 2x - 2\). For \(y > 3 - x\), graph the line \(y = 3 - x\). Use a solid line for \(y \geq 2x - 2\) because it includes equality, and a dashed line for \(y > 3 - x\) because it does not include equality.
Step 3: Determine the shading for each inequality. For \(y \geq 2x - 2\), shade the region above or on the line. For \(y > 3 - x\), shade the region above the line (not including the line).
Step 4: Find the intersection of the two shaded regions. This overlapping area represents the solution set that satisfies both inequalities simultaneously.
Step 5: Label the solution region clearly on the graph, indicating that it includes points where \(y\) is greater than or equal to \(2x - 2\) and strictly greater than \(3 - x\).


 Verified step by step guidance