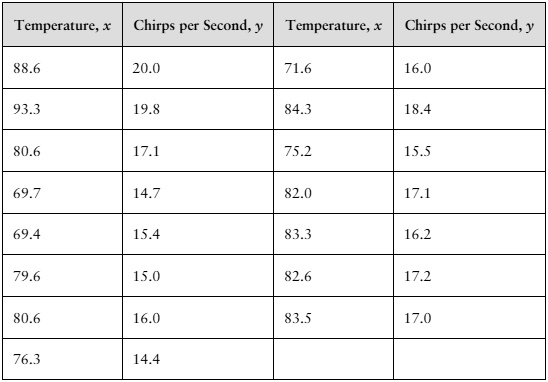
[DATA] Crickets make a chirping noise by sliding their wings rapidly over each other. Perhaps you have noticed that the number of chirps seems to increase with the temperature. The following table lists the temperature (in degrees Fahrenheit, °F) and the number of chirps per second for the striped ground cricket. i. Construct a 90% prediction interval for the number of chirps found in part (h).
Verified step by step guidance
1
Step 1: Identify the regression equation from part (h) that relates temperature (x) to chirps per second (y). This equation will be of the form \(\hat{y} = b_0 + b_1 x\), where \(b_0\) is the intercept and \(b_1\) is the slope.
Step 2: Calculate the predicted chirps per second \(\hat{y}^*\) for the specific temperature value \(x^*\) given in part (h) by substituting \(x^*\) into the regression equation.
Step 3: Compute the standard error of the prediction using the formula for the prediction interval standard error:
\[ SE_{pred} = s \sqrt{1 + \frac{1}{n} + \frac{(x^* - \bar{x})^2}{\sum (x_i - \bar{x})^2}} \]
where \(s\) is the standard error of the estimate, \(n\) is the number of data points, \(\bar{x}\) is the mean of the temperature values, and \(x_i\) are the individual temperature values.
Step 4: Determine the critical t-value \(t^*\) for a 90% prediction interval with \(n-2\) degrees of freedom from the t-distribution table.
Step 5: Construct the 90% prediction interval for the chirps per second at temperature \(x^*\) using the formula:
\[ \hat{y}^* \pm t^* \times SE_{pred} \]
This interval gives a range where we expect an individual future observation of chirps per second to fall with 90% confidence.
Verified video answer for a similar problem:
This video solution was recommended by our tutors as helpful for the problem above
Video duration:
2m
Play a video:
0 Comments
Key Concepts
Here are the essential concepts you must grasp in order to answer the question correctly.
Prediction Interval
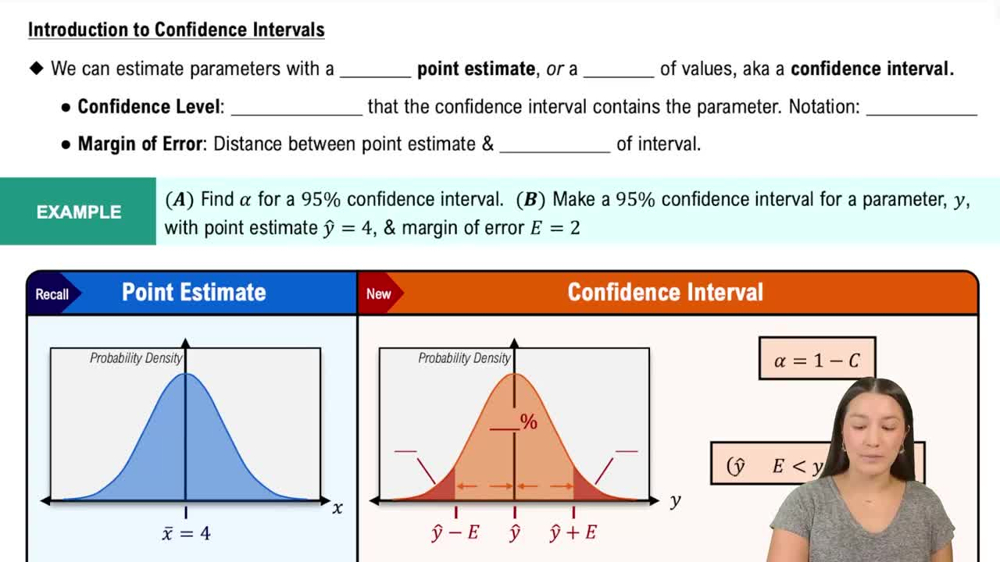
A prediction interval estimates the range within which a single new observation is expected to fall, with a certain level of confidence (e.g., 90%). It accounts for both the uncertainty in estimating the regression line and the natural variability of individual data points around that line.
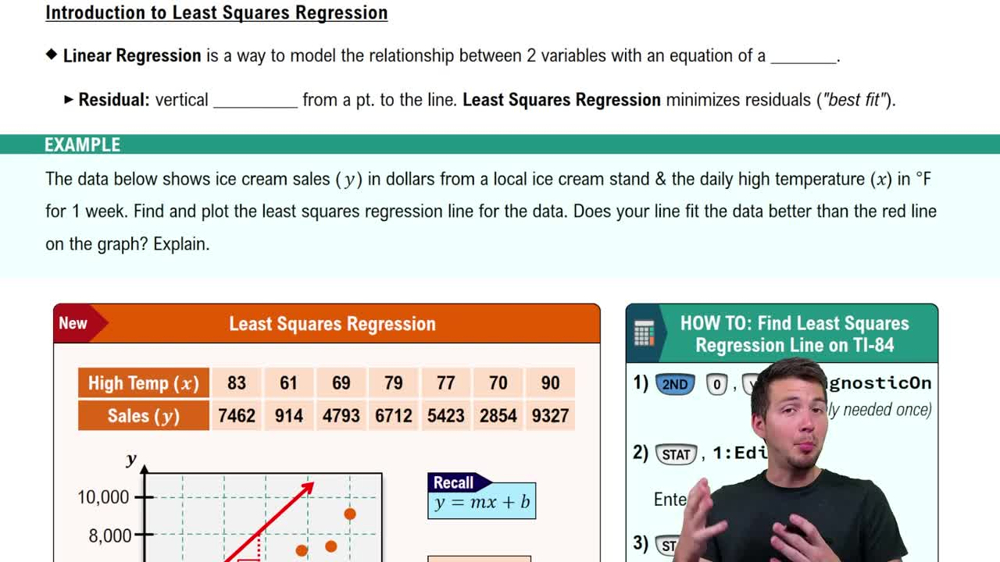
Linear regression models the relationship between two variables by fitting a straight line that minimizes the sum of squared differences between observed and predicted values. It helps predict the dependent variable (chirps per second) based on the independent variable (temperature).
The confidence level (e.g., 90%) indicates the proportion of similarly constructed intervals that would contain the true value if the experiment were repeated many times. Higher confidence levels produce wider intervals, reflecting greater uncertainty.

 Verified step by step guidance
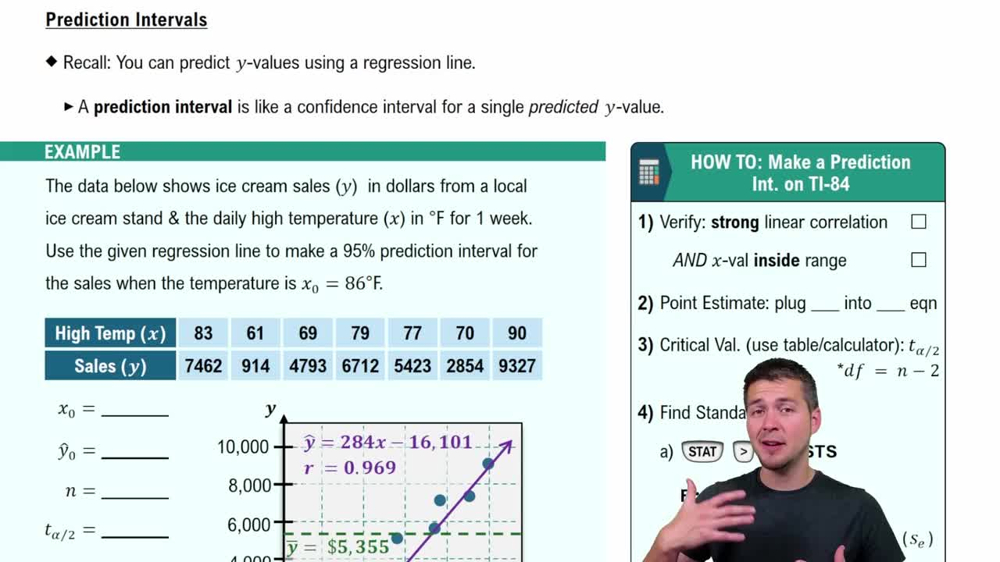
 09:00
09:00