Graph each function over a one-period interval. y = -4 sin(2x - π)
Verified step by step guidance
1
Identify the general form of the sine function: \(y = A \sin(Bx - C)\), where \(A\) is the amplitude, \(B\) affects the period, and \(C\) is the phase shift.
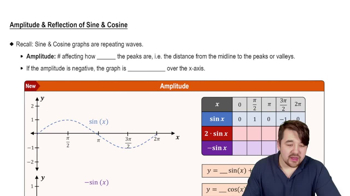
Determine the amplitude \(A\) by taking the absolute value of the coefficient in front of the sine function. Here, \(A = |-4| = 4\), so the graph will have peaks at \(4\) and troughs at \(-4\).
Calculate the period of the function using the formula \(\text{Period} = \frac{2\pi}{|B|}\). For \(y = -4 \sin(2x - \pi)\), \(B = 2\), so the period is \(\frac{2\pi}{2} = \pi\).
Find the phase shift by solving \(Bx - C = 0\) for \(x\), which gives \(x = \frac{C}{B}\). Here, \(x = \frac{\pi}{2}\), so the graph is shifted to the right by \(\frac{\pi}{2}\) units.
Use the amplitude, period, and phase shift to sketch the graph over one period interval starting at the phase shift \(x = \frac{\pi}{2}\) and ending at \(x = \frac{\pi}{2} + \pi\). Remember the negative sign in front of the sine flips the graph vertically.
Verified video answer for a similar problem:
This video solution was recommended by our tutors as helpful for the problem above
Play a video:
0 Comments
Key Concepts
Here are the essential concepts you must grasp in order to answer the question correctly.
Period of a Sine Function
The period of a sine function y = sin(bx) is given by 2π divided by the absolute value of b. It represents the length of one complete cycle of the wave. For y = -4 sin(2x - π), the period is 2π/2 = π, meaning the function repeats every π units along the x-axis.
Phase shift refers to the horizontal translation of the graph caused by a constant added or subtracted inside the function's argument. For y = -4 sin(2x - π), the phase shift is found by solving 2x - π = 0, giving x = π/2. This means the graph shifts π/2 units to the right.
Amplitude is the absolute value of the coefficient in front of the sine function, indicating the peak height from the midline. Here, the amplitude is 4. The negative sign reflects the graph across the x-axis, flipping the sine wave upside down.

 Verified step by step guidance
 5:33
5:33