"Constructing and Interpreting a Prediction Interval In Exercises 21-30, construct the indicated prediction interval and interpret the results. 26. Voter Turnout Construct a 99% prediction interval for number of ballots cast in Exercise 16 when the voting age population is 210 million."
Verified step by step guidance
1
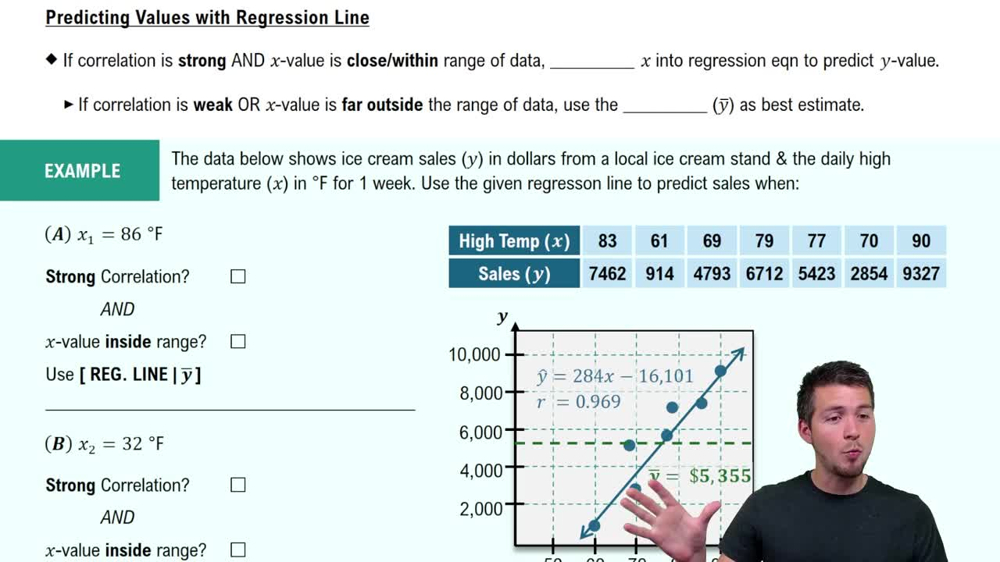
Identify the regression model from Exercise 16, which relates the voting age population (independent variable) to the number of ballots cast (dependent variable). This model typically has the form: , where is the predicted number of ballots cast and is the voting age population.
Calculate the predicted number of ballots cast for a voting age population of 210 million by substituting into the regression equation to find .
Determine the standard error of the prediction, which accounts for both the variability of the estimate of the mean response and the variability of individual observations. The formula for the standard error of prediction is: , where is the standard error of the estimate, is the sample size, is the mean of the independent variable, and is the value 210 million.
Find the critical t-value for a 99% prediction interval with degrees of freedom equal to . This value corresponds to the desired confidence level and is used to scale the standard error.
Construct the 99% prediction interval using the formula: . This interval estimates the range in which a single future observation (number of ballots cast) is expected to fall with 99% confidence when the voting age population is 210 million.
Verified video answer for a similar problem:
This video solution was recommended by our tutors as helpful for the problem above
Video duration:
5m
Play a video:
0 Comments
Key Concepts
Here are the essential concepts you must grasp in order to answer the question correctly.
Prediction Interval
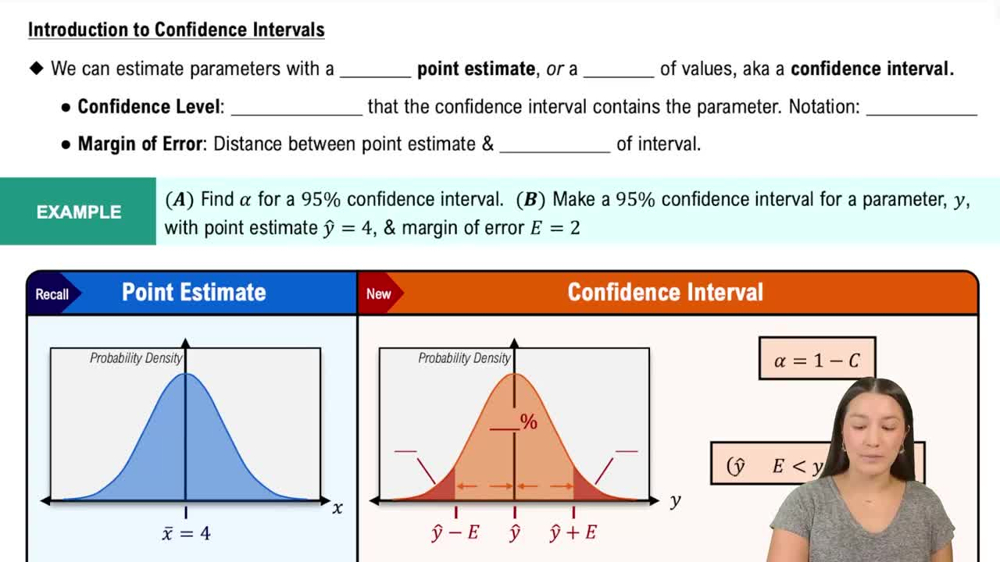
A prediction interval estimates the range within which a single future observation is expected to fall, with a specified level of confidence. Unlike confidence intervals for means, prediction intervals account for both the variability in the estimate and the inherent variability of individual data points.
The confidence level, such as 99%, represents the probability that the interval constructed from sample data contains the true value of the future observation. Higher confidence levels produce wider intervals, reflecting greater uncertainty but more assurance that the interval captures the true value.
Using a regression model, prediction intervals are constructed by plugging in a specific predictor value (e.g., voting age population) to estimate the response variable (e.g., ballots cast). This involves calculating the predicted value and adding a margin of error that accounts for both estimation uncertainty and natural variability.

 Verified step by step guidance
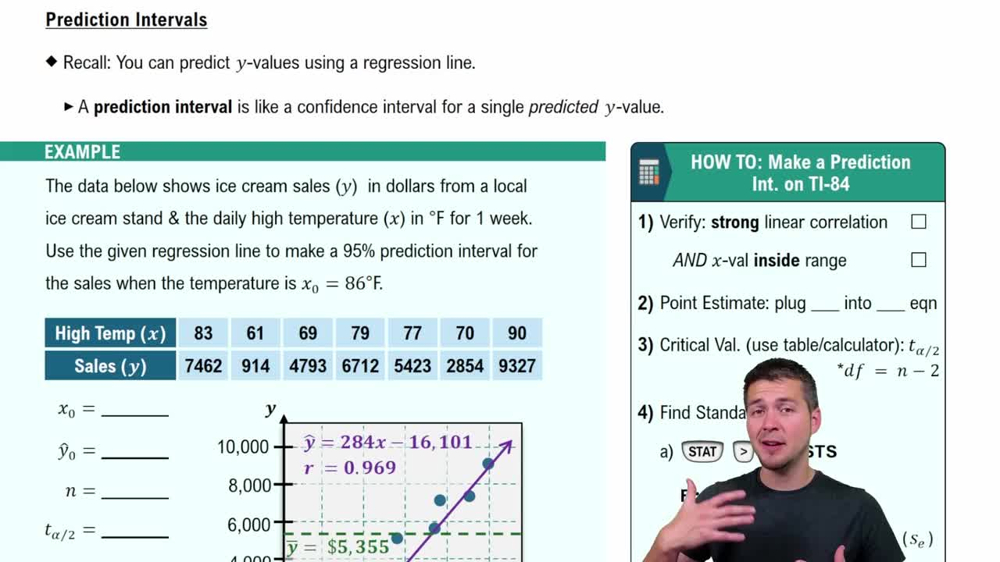
 09:00
09:00