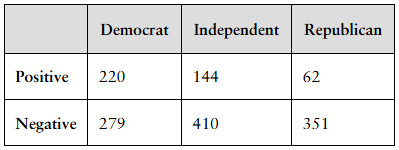
[NOW WORK] What’s in a Word? In a recent survey conducted by the Pew Research Center, a random sample of adults 18 years of age or older living in the continental United States was asked their reaction to the word socialism. In addition, the individuals were asked to disclose which political party they most associate with. Results of the survey are given in the table. a. Explain why this data should be analyzed by homogeneity of proportions.
Verified step by step guidance
1
Step 1: Understand the context of the data. The table shows survey responses categorized by political party affiliation (Democrat, Independent, Republican) and their reaction to the word 'socialism' (Positive or Negative).
Step 2: Recognize that the goal is to compare the distribution of responses (Positive vs. Negative) across different groups (political parties). This means we want to see if the proportions of positive and negative reactions differ by party.
Step 3: Recall that a test of homogeneity is used when we want to compare the distribution of a categorical variable (reaction: Positive/Negative) across different populations or groups (political parties). Here, each political party represents a different population.
Step 4: Note that the sample is drawn separately from each political party group, and we want to see if the proportions of positive and negative responses are the same or different across these groups.
Step 5: Conclude that this data should be analyzed by homogeneity of proportions because we are comparing the distribution of a categorical response variable across multiple independent groups to determine if the proportions are consistent or vary by group.
Verified video answer for a similar problem:
This video solution was recommended by our tutors as helpful for the problem above
Video duration:
1m
Play a video:
Was this helpful?
Key Concepts
Here are the essential concepts you must grasp in order to answer the question correctly.
Homogeneity of Proportions
Homogeneity of proportions tests whether different populations have the same proportion of a categorical outcome. In this context, it checks if the proportion of positive and negative reactions to the word 'socialism' is consistent across political affiliations. This helps determine if political party influences the perception of the word.
Categorical data represent variables with distinct groups or categories, such as political party and reaction type here. Contingency tables summarize the frequency counts of these categories, allowing comparison across groups. Analyzing such tables helps identify relationships or differences between categories.
Random sampling ensures each individual in the population has an equal chance of selection, reducing bias. This makes the sample representative of the broader population, allowing valid generalizations. The survey’s random sample of adults supports reliable analysis of opinions by political party.

 Verified step by step guidance
 05:27
05:27
