
Multiple Choice
In linear regression using the least squares method, the least squares regression line minimizes the sum of the , where represents the residuals (the differences between observed and predicted values).
113
views
 Verified step by step guidanceVerified video answer for a similar problem:
 06:14
06:14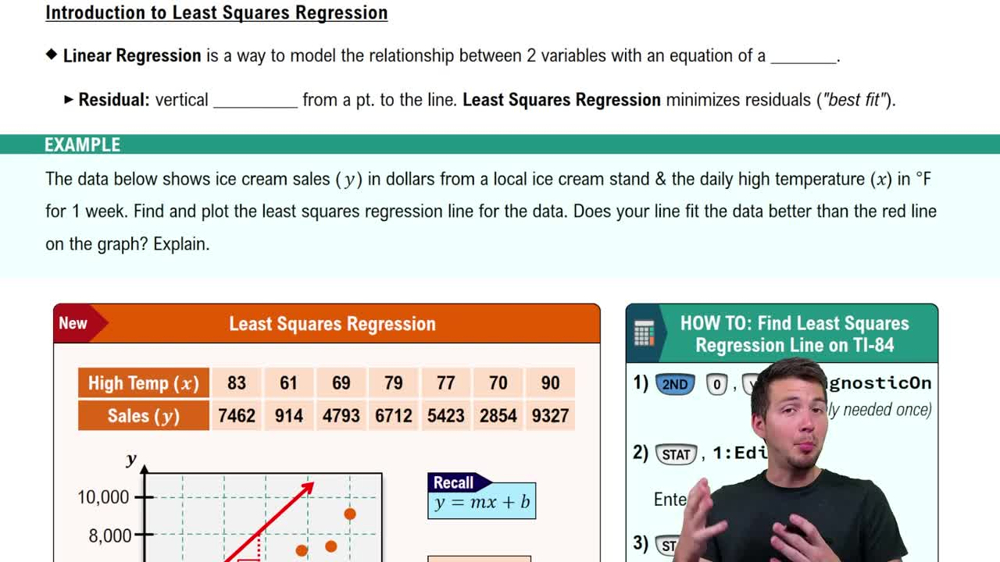 07:01
07:01 04:48
04:48