
Multiple Choice
In the context of linear regression using the least squares method, what does each point on the least-squares regression line represent?
81
views
 Verified step by step guidanceVerified video answer for a similar problem:
 08:45
08:45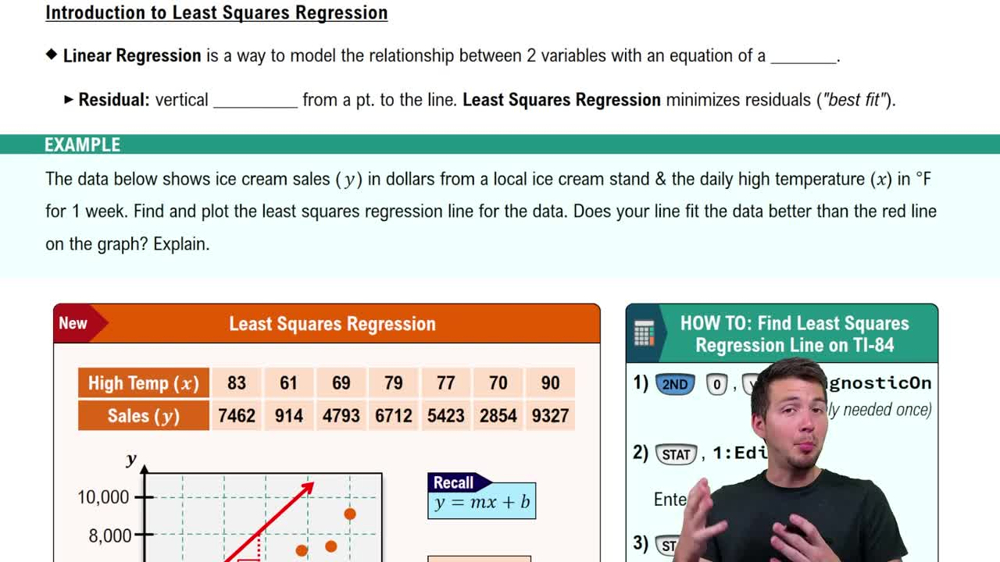 07:01
07:01 4:01
4:01