
Textbook Question
True or False: The distribution of the sample mean, x̄, will be approximately normally distributed if the sample is obtained from a population that is not normally distributed, regardless of the sample size.
57
views
 Verified step by step guidanceVerified video answer for a similar problem:
 05:11 05:11
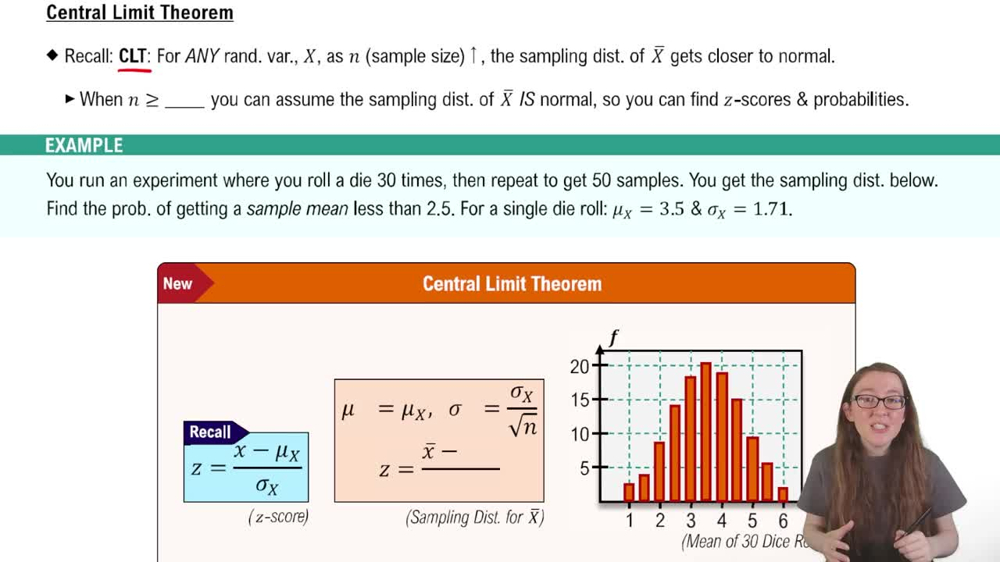 05:14
05:14