In Problems 5–12, find the indicated areas. For each problem, be sure to draw a standard normal curve and shade the area that is to be found. Determine the area under the standard normal curve that lies to the left of
b. z = –0.43
Verified step by step guidance
1
Understand that the problem asks for the area under the standard normal curve to the left of the given z-score, which represents the cumulative probability \(P(Z < -0.43)\).
Recall that the standard normal distribution is symmetric about zero, with mean 0 and standard deviation 1, and the total area under the curve is 1.
Use the standard normal distribution table (Z-table) or a calculator with normal distribution functions to find the cumulative area corresponding to \(z = -0.43\).
Locate the row for \(-0.4\) and the column for \(0.03\) in the Z-table to find the cumulative probability for \(z = -0.43\).
Interpret the value found as the area to the left of \(z = -0.43\) under the standard normal curve, which is the required probability.
Verified video answer for a similar problem:
This video solution was recommended by our tutors as helpful for the problem above
Video duration:
1m
Play a video:
0 Comments
Key Concepts
Here are the essential concepts you must grasp in order to answer the question correctly.
Standard Normal Distribution
The standard normal distribution is a normal distribution with a mean of 0 and a standard deviation of 1. It is symmetric and bell-shaped, used to model standardized data. Values on this curve are represented by z-scores, which indicate how many standard deviations a point is from the mean.
Finding Standard Normal Probabilities using z-Table
Z-Score
A z-score measures the position of a data point relative to the mean of a distribution, expressed in standard deviations. Negative z-scores lie to the left of the mean, while positive ones lie to the right. In this problem, z = –0.43 indicates a point slightly left of the mean on the standard normal curve.
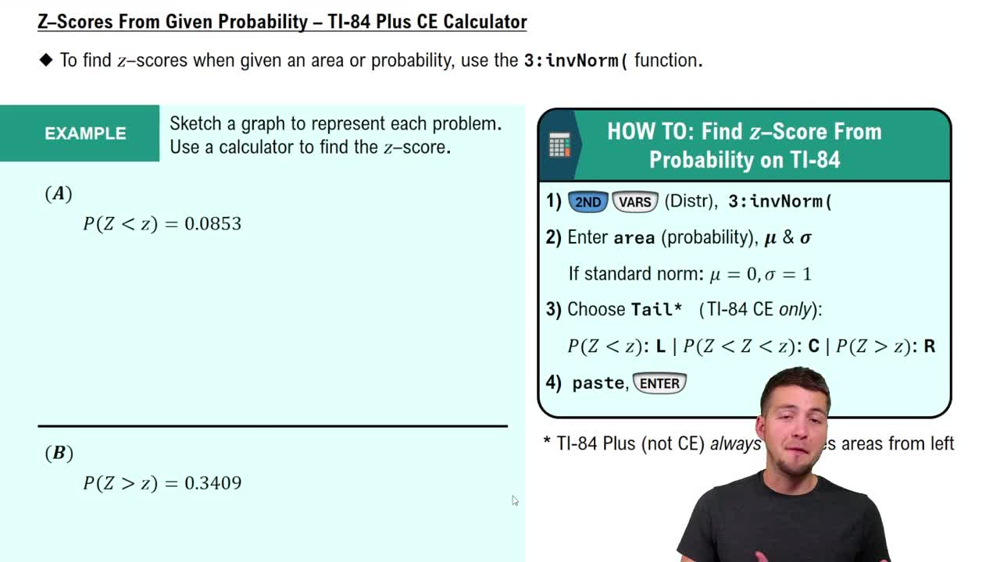
Z-Scores From Given Probability - TI-84 (CE) Calculator
Area Under the Curve (Probability)
The area under the standard normal curve to the left of a given z-score represents the cumulative probability of observing a value less than that z-score. This area can be found using standard normal tables or technology, and it corresponds to the proportion of data below the specified z-value.

 Verified step by step guidance
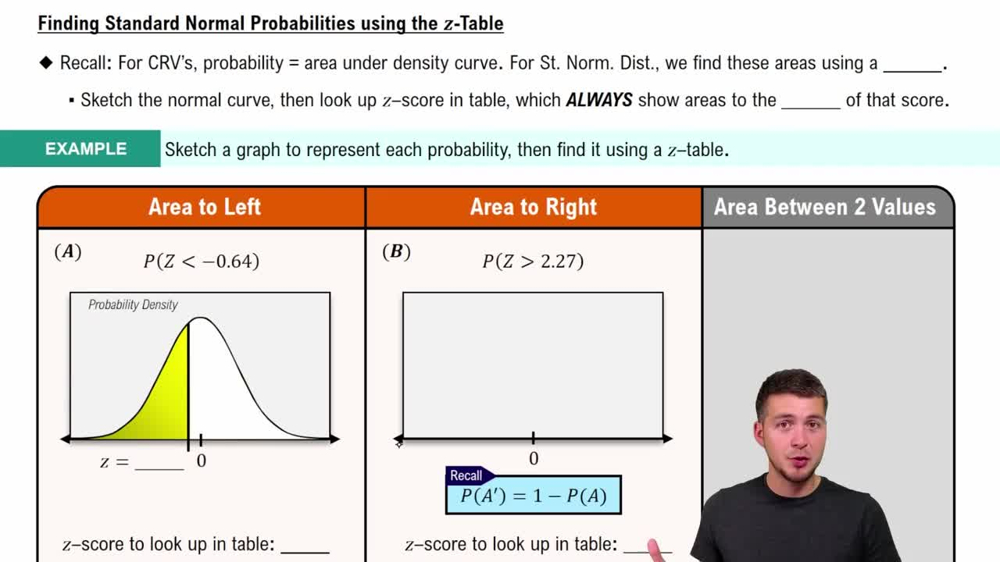
 09:47
09:47