Ch. 4 - Graphs of the Circular Functions
Lial - Trigonometry 12th Edition
Lial12th EditionTrigonometryISBN: 9780136552161Not the one you use?Change textbook
Chapter 5, Problem 11

Match each function with its graph in choices A–I. (One choice will not be used.)
y = cos (x - π/4)


A. <IMAGE> B. <IMAGE> C. <IMAGE>


D. <IMAGE> E. <IMAGE> F. <IMAGE>


G. <IMAGE> H. <IMAGE> I. <IMAGE>

Verified step by step guidance
1
Understand that the function given is \(y = \cos\left(x - \frac{\pi}{4}\right)\), which represents a horizontal shift of the basic cosine function \(y = \cos x\) to the right by \(\frac{\pi}{4}\) units.
Recall the key features of the cosine graph: it has a maximum value of 1 at \(x=0\), crosses zero at \(x=\frac{\pi}{2}\), reaches a minimum of -1 at \(x=\pi\), and completes one full period at \(x=2\pi\).
Apply the horizontal shift to these key points by adding \(\frac{\pi}{4}\) to each x-coordinate, so the maximum now occurs at \(x=\frac{\pi}{4}\), the zero crossing at \(x=\frac{3\pi}{4}\), the minimum at \(x=\pi + \frac{\pi}{4} = \frac{5\pi}{4}\), and so on.
Examine each graph choice (A through I) and identify which one shows a cosine wave shifted to the right by \(\frac{\pi}{4}\), matching the shifted key points and shape of the cosine function.
Select the graph that matches these characteristics, and note that one graph will not correspond to any function given, so it will remain unused.

Verified video answer for a similar problem:

This video solution was recommended by our tutors as helpful for the problem above.
Was this helpful?

Key Concepts

Here are the essential concepts you must grasp in order to answer the question correctly.

Phase Shift in Trigonometric Functions

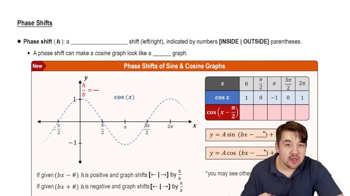
Phase shift refers to the horizontal translation of a trigonometric graph caused by adding or subtracting a constant inside the function's argument. For y = cos(x - π/4), the graph shifts π/4 units to the right compared to y = cos(x). Understanding phase shifts helps identify how the graph moves along the x-axis.
Recommended video:
6:31
Phase Shifts

Basic Shape and Properties of the Cosine Function

The cosine function is periodic with period 2π, oscillating between -1 and 1, starting at a maximum value of 1 when x = 0. Recognizing its characteristic wave shape and key points (maxima, minima, zeros) is essential for matching the function to its graph.
Recommended video:
5:53
Graph of Sine and Cosine Function

Graph Matching Techniques for Trigonometric Functions

Matching a trigonometric function to its graph involves analyzing shifts, amplitude, period, and key points. By comparing these features with given graphs, one can identify the correct match and exclude incorrect options, especially when one choice remains unused.
Recommended video:
6:04
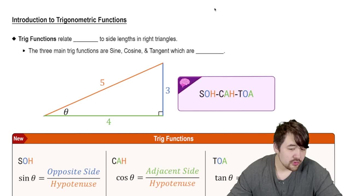
Introduction to Trigonometric Functions