A ________________ test is an inferential procedure used to determine whether a frequency distribution follows a specific distribution.
Verified step by step guidance
1
Identify the type of test used to compare observed frequency distributions with expected frequency distributions under a specific theoretical distribution.
Recall that this test is commonly used to assess goodness of fit, which measures how well the observed data matches the expected distribution.
Understand that the test involves calculating a test statistic based on the differences between observed and expected frequencies.
Recognize that the test statistic follows a chi-square distribution under the null hypothesis that the observed distribution matches the expected distribution.
Conclude that the name of this test is the Chi-Square Goodness of Fit test.
Verified video answer for a similar problem:
This video solution was recommended by our tutors as helpful for the problem above
Video duration:
1m
Play a video:
0 Comments
Key Concepts
Here are the essential concepts you must grasp in order to answer the question correctly.
Inferential Statistics
Inferential statistics involves methods that allow us to make conclusions or predictions about a population based on sample data. It uses probability theory to test hypotheses and estimate parameters, helping to determine if observed patterns are statistically significant.
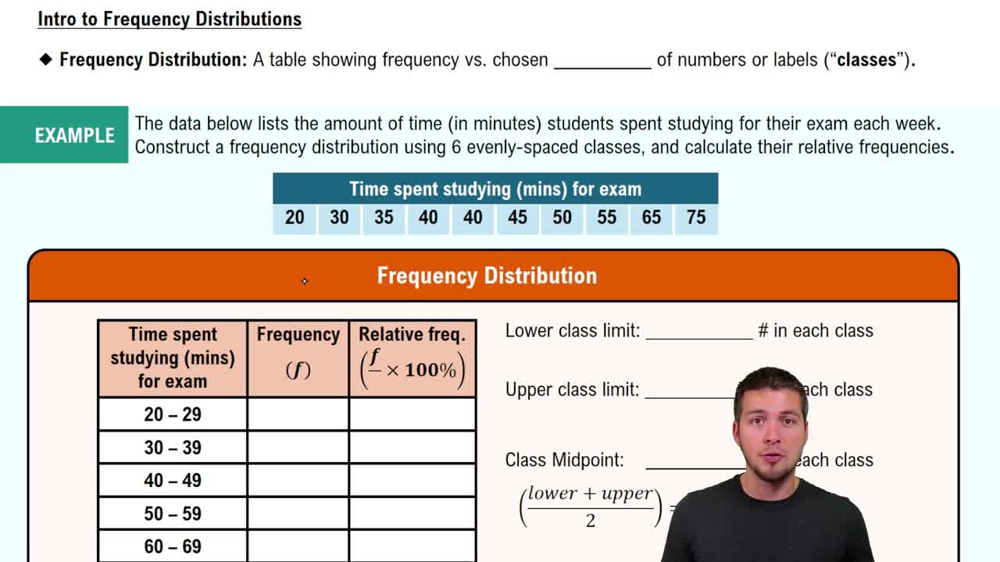
A frequency distribution is a summary of how often each value or category occurs in a dataset. It organizes data into classes or categories, showing the count or frequency of observations, which helps in understanding the data's overall pattern.
A goodness-of-fit test is a statistical test used to assess whether observed frequencies match expected frequencies from a specific theoretical distribution. It helps determine if the data fits a hypothesized distribution, such as the chi-square goodness-of-fit test.

 Verified step by step guidance
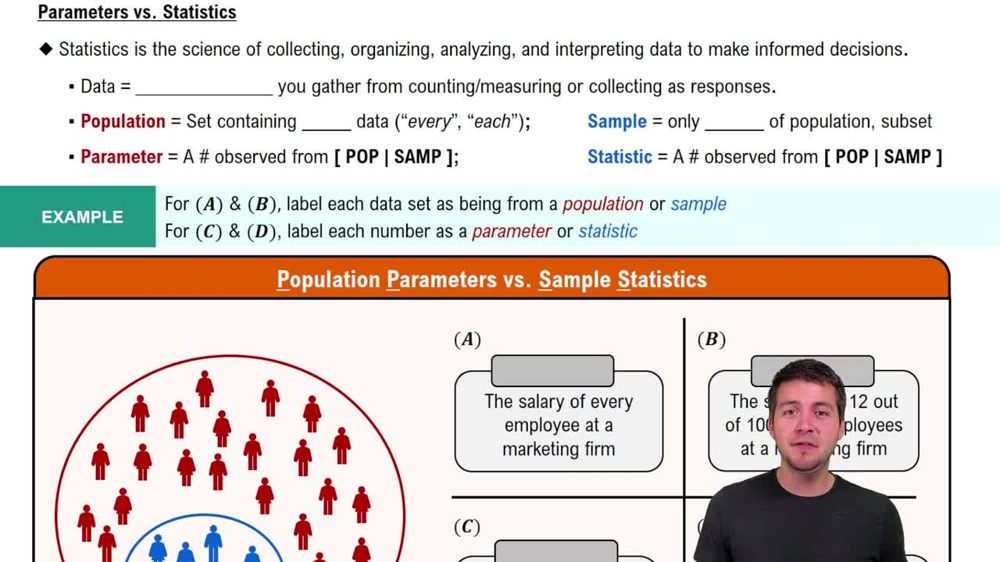
 05:53
05:53