Benford’s Law, Part I Our number system consists of the digits 0, 1, 2, 3, 4, 5, 6, 7, 8, and 9. The first significant digit in any number must be 1, 2, 3, 4, 5, 6, 7, 8, or 9 because we do not write numbers such as 12 as 012. Although we may think that each first digit appears with equal frequency so that each digit has a 1/9 probability of being the first significant digit, this is not true. In 1881, Simon Newcomb discovered that first digits do not occur with equal frequency. This same result was discovered again in 1938 by physicist Frank Benford. After studying much data, he was able to assign probabilities of occurrence to the first digit in a number as shown.
[Image]
Source: T. P. Hill, “The First Digit Phenomenon,” American Scientist, July—August, 1998.
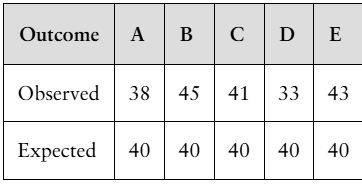
The probability distribution is now known as Benford’s Law and plays a major role in identifying fraudulent data on tax returns and accounting books. For example, the following distribution represents the first digits in 200 allegedly fraudulent checks written to a bogus company by an employee attempting to embezzle funds from his employer.
a. Because these data are meant to prove that someone is guilty of fraud, what would be an appropriate level of significance when performing a goodness-of-fit test?

 Verified step by step guidance
 06:34
06:34