In Problems 5–12, find the indicated areas. For each problem, be sure to draw a standard normal curve and shade the area that is to be found. Determine the total area under the standard normal curve
c. to the left of z = –0.24 or to the right of z = 1.20
Verified step by step guidance
1
First, understand that the problem asks for the total area under the standard normal curve to the left of z = -0.24 or to the right of z = 1.20. This means we are looking for the combined probability of these two regions.
Draw a standard normal curve (a bell-shaped curve centered at 0) and mark the points z = -0.24 and z = 1.20 on the horizontal axis. Shade the area to the left of z = -0.24 and the area to the right of z = 1.20 to visualize the regions of interest.
Recall that the total area under the standard normal curve is 1. The area to the left of a z-value corresponds to the cumulative probability up to that z-value, which can be found using the standard normal distribution table or a calculator.
Find the cumulative area to the left of z = -0.24, denoted as \(P(Z < -0.24)\), and find the cumulative area to the left of z = 1.20, denoted as \(P(Z < 1.20)\). Then, calculate the area to the right of z = 1.20 by subtracting the cumulative area from 1: \(P(Z > 1.20) = 1 - P(Z < 1.20)\).
Finally, add the two areas together to get the total area: \(P(Z < -0.24) + P(Z > 1.20)\). This sum represents the probability of being either less than -0.24 or greater than 1.20 under the standard normal curve.
Verified video answer for a similar problem:
This video solution was recommended by our tutors as helpful for the problem above
Video duration:
2m
Play a video:
0 Comments
Key Concepts
Here are the essential concepts you must grasp in order to answer the question correctly.
Standard Normal Distribution
The standard normal distribution is a normal distribution with a mean of 0 and a standard deviation of 1. It is symmetric about zero, and its total area under the curve equals 1. Z-scores represent the number of standard deviations a value is from the mean.
Finding Standard Normal Probabilities using z-Table
Z-Score and Area Under the Curve
A z-score indicates a position on the standard normal curve. The area to the left of a z-score corresponds to the cumulative probability up to that point. Finding areas to the left or right of z-values involves using standard normal tables or technology to determine probabilities.
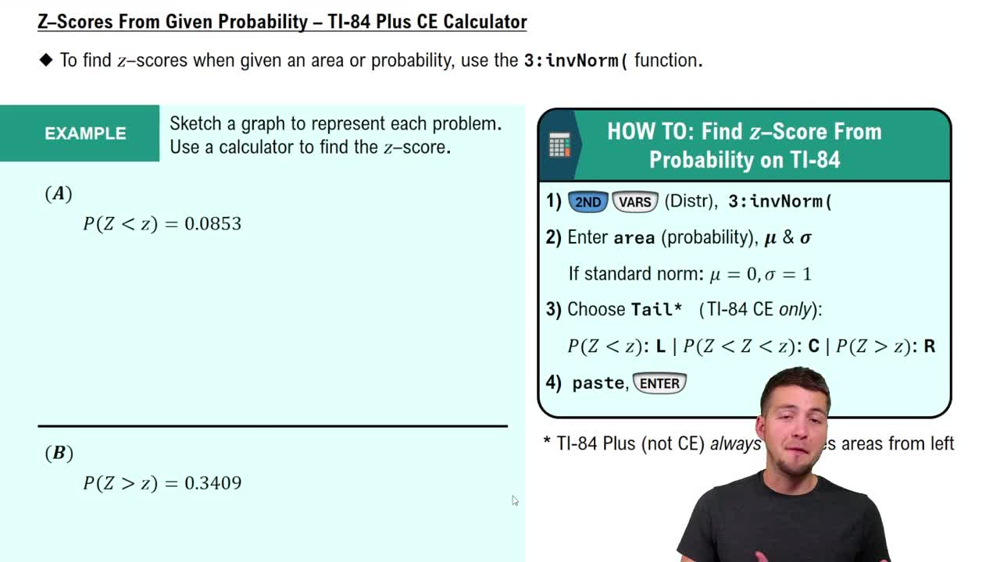
Z-Scores From Given Probability - TI-84 (CE) Calculator
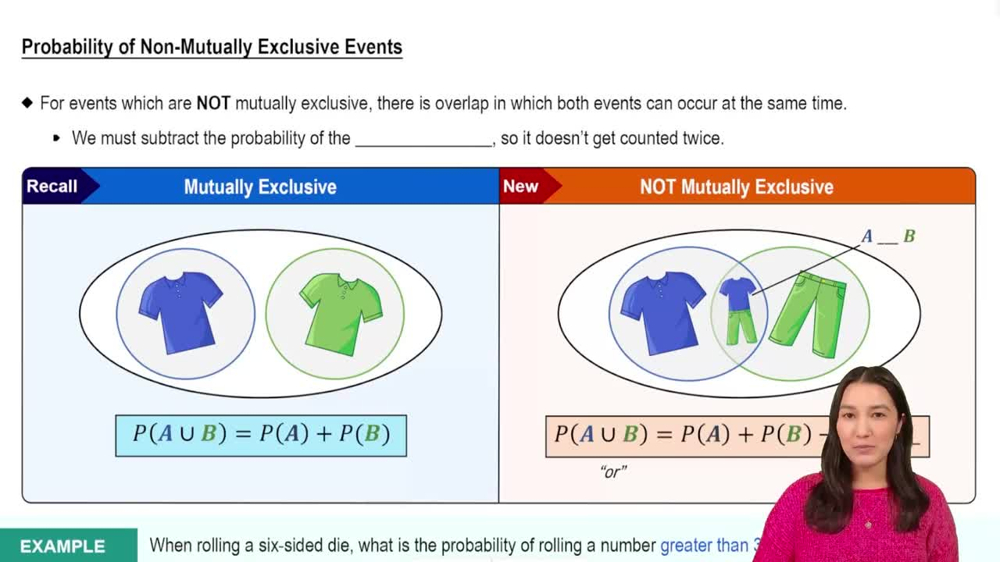
Addition Rule for Probabilities
When finding the total area for 'to the left of z = –0.24 or to the right of z = 1.20,' the addition rule applies. Since these two regions do not overlap, their probabilities can be added directly to find the combined area under the curve.

 Verified step by step guidance
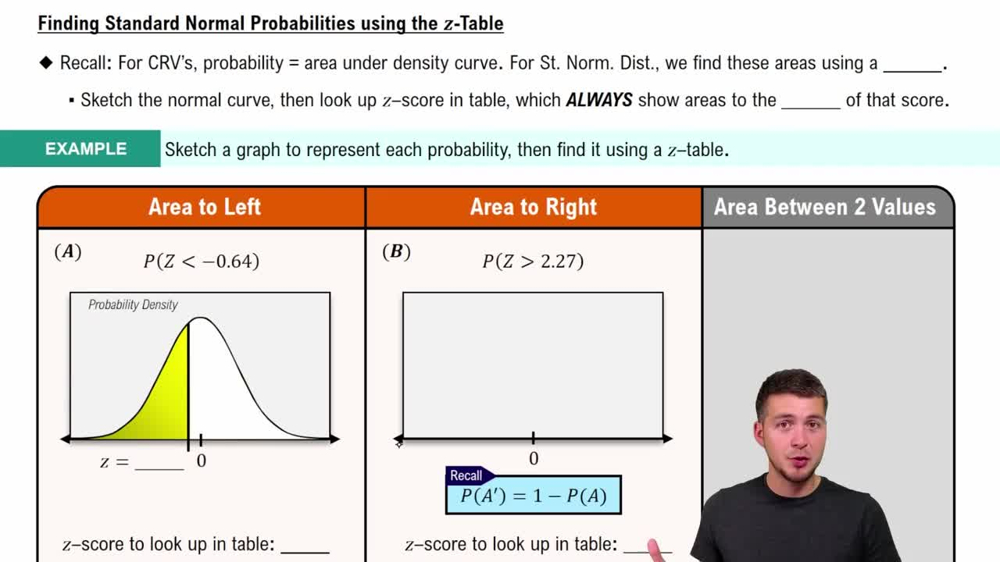
 09:47
09:47