Ch. 3 - Probability
Larson - Elementary Statistics: Picturing the World 8th Edition
Larson8th EditionElementary Statistics: Picturing the WorldISBN: 9780137493470Not the one you use?Change textbook
Chapter 3, Problem 3.3.23c

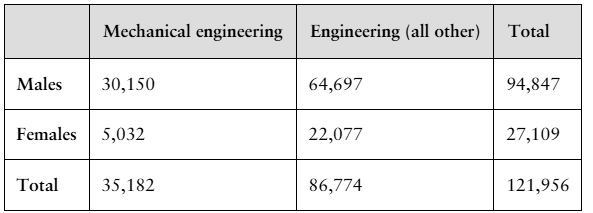
23. Engineering Degrees The table shows the numbers of male and female students in the U.S. who received B.S. degrees in engineering in a recent year. A student earning a B.S. degree in engineering during that year is selected at random. Find the probability of each event.
(Source: National Center for Educational Statistics)
Table displaying the number of male and female students earning engineering degrees, including totals for mechanical engineering.
c. The student is not female or did not receive a mechanical engineering degree.

Verified step by step guidance
1
Step 1: Understand the problem. We are tasked with finding the probability that a randomly selected student is not female or did not receive a mechanical engineering degree. This involves using the complement rule and the addition rule in probability.
Step 2: Identify the total number of students. From the table, the total number of students who received B.S. degrees in engineering is 121,956.
Step 3: Calculate the number of students who are female and received a mechanical engineering degree. From the table, the number of females who received mechanical engineering degrees is 5,032.
Step 4: Use the complement rule to find the number of students who are not female or did not receive a mechanical engineering degree. This is equivalent to subtracting the number of students who are female and received a mechanical engineering degree from the total number of students.
Step 5: Divide the result from Step 4 by the total number of students (121,956) to find the probability. This gives the probability that a randomly selected student is not female or did not receive a mechanical engineering degree.

Verified video answer for a similar problem:

This video solution was recommended by our tutors as helpful for the problem above.
Video duration:
4m
Was this helpful?

Key Concepts

Here are the essential concepts you must grasp in order to answer the question correctly.

Probability

Probability is a measure of the likelihood that an event will occur, expressed as a number between 0 and 1. In this context, it involves calculating the chance of selecting a student who is either not female or did not receive a mechanical engineering degree. This requires understanding how to combine probabilities of different events.
Recommended video:
5:37
Introduction to Probability

Complementary Events

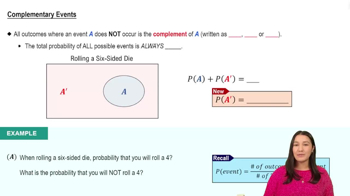
Complementary events are pairs of outcomes in a probability scenario where one event occurs if and only if the other does not. In this case, the event of selecting a student who is not female or did not receive a mechanical engineering degree can be analyzed by considering the complementary event: selecting a female student who received a mechanical engineering degree.
Recommended video:
4:23
Complementary Events

Joint Probability

Joint probability refers to the probability of two events occurring simultaneously. To solve the question, one must calculate the joint probability of selecting a female student who received a mechanical engineering degree and then use this to find the probability of the complementary event. This involves using the data from the table to determine the relevant counts.
Recommended video:
5:37
Introduction to Probability
Related Practice
Textbook Question

"Using the Multiplication Rule In Exercises 19-32, use the Multiplication Rule.

24. Knowing a Person Who Was Murdered In a sample of 11,771 children ages 2 to 17, 8% have lost a friend or relative to murder. Four children are selected at random. (Adapted from University of New Hampshire)

c. Find the probability that at least one of the four has lost a friend or relative to murder."

55
views
Textbook Question

Using the Multiplication Rule In Exercises 19-32, use the Multiplication Rule.

26. Worst President In a sample of 1500 adult U.S. citizens, 690 said that Donald Trump was the worst president in U.S. history. Three adult U.S. citizens are selected at random.

(Adapted from YouGov)

c. Find the probability that at most two of the three adult U.S. citizens say that Donald Trump was the worst president in U.S. history.

127
views
Textbook Question

Using the Multiplication Rule In Exercises 19-32, use the Multiplication Rule.

27. Blood Types The probability that a person of Asian descent in the United States has type O+ blood is 39%. At random, six people of Asian descent in the United States are selected. (Source: American National Red Cross)

c. Find the probability that at least one of the six has type O+ blood.

74
views
Textbook Question

81. Genetics A Punnett square is a diagram that shows all possible gene combinations in a cross of parents whose genes are known. When two pink snapdragon flowers (RW) are crossed, there are four equally likely possible outcomes for the genetic makeup of the offspring: red (RR), pink (RW), pink (WR), and white (WW), as shown in the Punnett square at the left. When two pink snapdragons are crossed, what is the probability that the offspring will be (c) white?

131
views
Textbook Question

17. Selecting a Card A card is selected at random from a standard deck of 52 playing cards. Find the probability of each event.

c. Randomly selecting a 9 or a face card

388
views
Textbook Question

Mental Health A survey asks 4805 parents the severity of the mental issues they experienced from the coronavirus pandemic. The results are shown in the table. A parent is randomly selected from the sample. Find the probability of each event. (Adapted from Kaiser Family Foundation)

" style="" width="345">

c. The parent did not have major mental health issues or is a mother.

104
views