Join thousands of students who trust us to help them ace their exams!
Multiple Choice
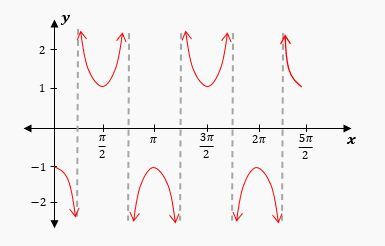
Below is a graph of the function y=sec(bx−π). Determine the value of b.
A
b=2
B
b=4
C
b=2π
D
b=π
0 Comments
Verified step by step guidance
1
Identify the period of the secant function from the graph. The secant function, y = sec(bx - π), has vertical asymptotes where the cosine function is zero. These occur at regular intervals, which help determine the period.
Observe the graph and note the distance between consecutive vertical asymptotes. In this graph, the vertical asymptotes occur at x = π/2, 3π/2, 5π/2, etc.
Calculate the period of the function. The distance between consecutive vertical asymptotes is π, which is the period of the secant function in this graph.
Recall that the period of the secant function y = sec(bx - π) is given by 2π/b. Set this equal to the observed period from the graph: 2π/b = π.
Solve for b by multiplying both sides of the equation by b and then dividing by π. This gives b = 2.


 Verified step by step guidance
