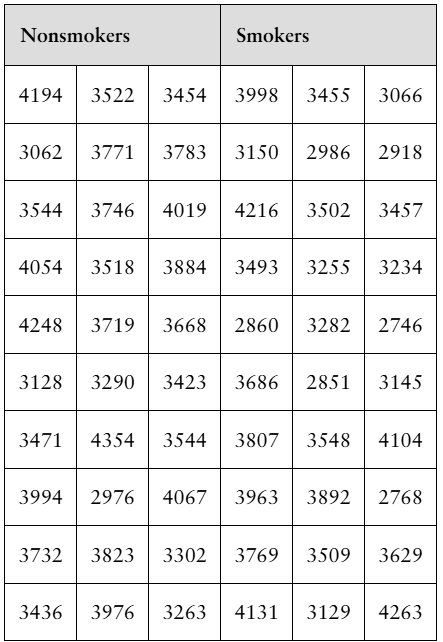
"[DATA] Putting It Together: Paternal Smoking It is well-documented that active maternal smoking during pregnancy is associated with lower-birth-weight babies. Researchers wanted to determine if there is a relationship between paternal smoking habits and birth weight. The researchers administered a questionnaire to each parent of newborn infants. One question asked whether the individual smoked regularly. Because the survey was administered within 15 days of birth, it was assumed that any regular smokers were also regular smokers during pregnancy. Birth weights for the babies (in grams) of nonsmoking mothers were obtained and divided into two groups, nonsmoking fathers and smoking fathers. The given data are representative of the data collected by the researchers. The researchers concluded that the birth weight of babies whose father smoked was less than the birth weight of babies whose father did not smoke. e. Determine summary statistics (mean, median, standard deviation, quartiles) for each group."
Verified step by step guidance
1
Step 1: Organize the data for each group (Nonsmokers and Smokers) into separate lists to facilitate calculations. For example, list all birth weights for nonsmokers and all birth weights for smokers.
Step 2: Calculate the mean for each group by summing all birth weights in the group and dividing by the number of observations. Use the formula: \(\text{Mean} = \frac{\sum x_i}{n}\), where \(x_i\) are the birth weights and \(n\) is the number of data points.
Step 3: Find the median for each group by first sorting the birth weights in ascending order. If the number of observations is odd, the median is the middle value. If even, it is the average of the two middle values.
Step 4: Calculate the standard deviation for each group to measure the spread of the birth weights. Use the formula for sample standard deviation: \(s = \sqrt{\frac{1}{n-1} \sum (x_i - \bar{x})^2}\), where \(\bar{x}\) is the mean.
Step 5: Determine the quartiles (Q1 and Q3) for each group by dividing the sorted data into four equal parts. Q1 is the median of the lower half of the data, and Q3 is the median of the upper half. These help understand the distribution of birth weights.
Verified video answer for a similar problem:
This video solution was recommended by our tutors as helpful for the problem above
Video duration:
11m
Play a video:
0 Comments
Key Concepts
Here are the essential concepts you must grasp in order to answer the question correctly.
Summary Statistics
Summary statistics such as mean, median, standard deviation, and quartiles provide a concise description of a data set. The mean gives the average value, the median indicates the middle value when data is ordered, the standard deviation measures data spread, and quartiles divide data into four equal parts to show distribution.
Comparing summary statistics between two groups helps identify differences or similarities in their distributions. In this case, comparing birth weights of babies with smoking versus nonsmoking fathers can reveal potential effects of paternal smoking on birth weight.
Data Grouping and Assumptions in Observational Studies
Grouping data based on characteristics (e.g., smoking status) allows focused analysis. Assumptions, such as regular smokers during pregnancy, are necessary to interpret observational data but can affect conclusions if inaccurate, highlighting the importance of careful data collection and context.

 Verified step by step guidance
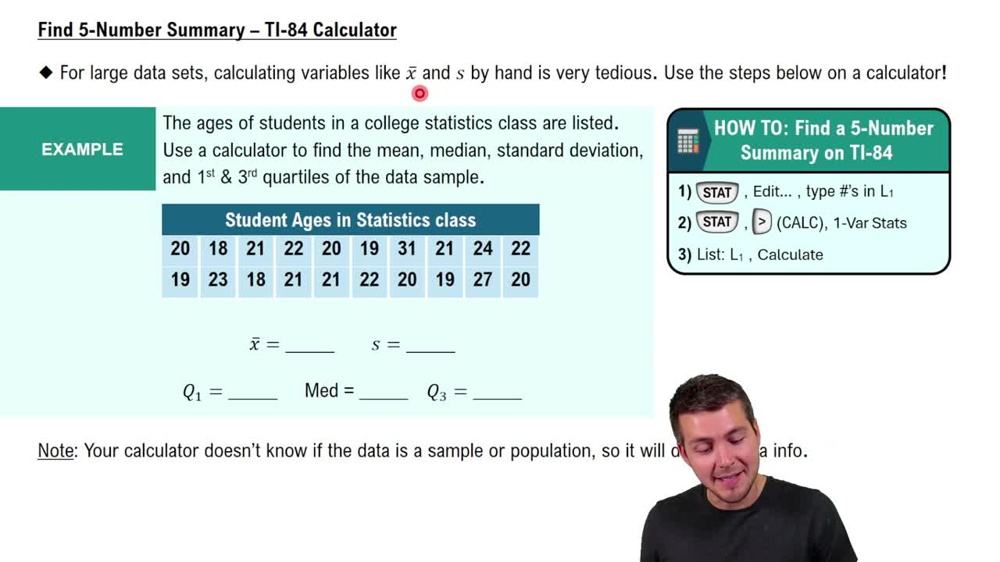
 04:51
04:51