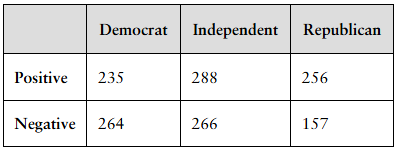
What’s in a Word? Part II In a recent survey conducted by the Pew Research Center, a random sample of adults 18 years of age or older living in the continental United States was asked their reaction to the word capitalism. In addition, the individuals were asked to disclose which political party they most associate with. Results of the survey are given in the table below. a. Does the evidence suggest individuals within each political affiliation react differently to the word capitalism? Use the alpha = 0.05 level of significance.
Verified step by step guidance
1
Step 1: Identify the type of test needed. Since we want to determine if the reaction to the word 'capitalism' differs by political affiliation, and the data is categorical (Positive/Negative reactions across Democrat, Independent, Republican), we use a Chi-Square Test of Independence.
Step 2: Set up the hypotheses. The null hypothesis (\(H_0\)) states that the reaction to the word 'capitalism' is independent of political affiliation (no association). The alternative hypothesis (\(H_a\)) states that the reaction depends on political affiliation (there is an association).
Step 3: Calculate the expected counts for each cell in the table using the formula:
\[\text{Expected Count} = \frac{(\text{Row Total}) \times (\text{Column Total})}{\text{Grand Total}}\]
This means for each cell, multiply the total number of responses in that row by the total number of responses in that column, then divide by the overall total number of responses.
Step 4: Compute the Chi-Square test statistic using the formula:
\[\chi^2 = \sum \frac{(\text{Observed} - \text{Expected})^2}{\text{Expected}}\]
Sum this value over all cells in the table.
Step 5: Determine the degrees of freedom for the test, which is calculated as:
\[df = (\text{number of rows} - 1) \times (\text{number of columns} - 1)\]
Then, compare the calculated Chi-Square statistic to the critical value from the Chi-Square distribution table at \(\alpha = 0.05\) and the calculated degrees of freedom. If the test statistic exceeds the critical value, reject the null hypothesis, indicating that reactions differ by political affiliation.
Verified video answer for a similar problem:
This video solution was recommended by our tutors as helpful for the problem above
Video duration:
8m
Play a video:
0 Comments
Key Concepts
Here are the essential concepts you must grasp in order to answer the question correctly.
Chi-Square Test for Independence
The chi-square test for independence assesses whether two categorical variables are related or independent. In this context, it tests if political affiliation and reaction to the word 'capitalism' are associated. The test compares observed frequencies with expected frequencies under the assumption of independence.
A contingency table displays the frequency distribution of variables to analyze the relationship between them. Here, the table shows counts of positive and negative reactions across political affiliations, providing the data needed to perform the chi-square test.
The significance level (alpha = 0.05) defines the threshold for rejecting the null hypothesis, which states no association between variables. If the p-value from the chi-square test is less than alpha, we conclude a significant relationship exists between political affiliation and reaction.

 Verified step by step guidance
 06:28
06:28
