Government Solutions?In May, 2000, the Gallup Organization reported that 11% of adult Americans had a great deal of trust and confidence in the federal government handling domestic issues. Suppose a survey of a random sample of 1100 adult Americans finds that 84 have a great deal of trust and confidence in the federal government handling domestic issues. Would these results be considered unusual? Why?
Table of contents
- 1. Intro to Stats and Collecting Data1h 14m
- 2. Describing Data with Tables and Graphs1h 55m
- 3. Describing Data Numerically2h 5m
- 4. Probability2h 16m
- 5. Binomial Distribution & Discrete Random Variables3h 6m
- 6. Normal Distribution and Continuous Random Variables2h 11m
- 7. Sampling Distributions & Confidence Intervals: Mean3h 23m
- Sampling Distribution of the Sample Mean and Central Limit Theorem19m
- Distribution of Sample Mean - Excel23m
- Introduction to Confidence Intervals15m
- Confidence Intervals for Population Mean1h 18m
- Determining the Minimum Sample Size Required12m
- Finding Probabilities and T Critical Values - Excel28m
- Confidence Intervals for Population Means - Excel25m
- 8. Sampling Distributions & Confidence Intervals: Proportion1h 25m
- 9. Hypothesis Testing for One Sample3h 29m
- 10. Hypothesis Testing for Two Samples4h 50m
- Two Proportions1h 13m
- Two Proportions Hypothesis Test - Excel28m
- Two Means - Unknown, Unequal Variance1h 3m
- Two Means - Unknown Variances Hypothesis Test - Excel12m
- Two Means - Unknown, Equal Variance15m
- Two Means - Unknown, Equal Variances Hypothesis Test - Excel9m
- Two Means - Known Variance12m
- Two Means - Sigma Known Hypothesis Test - Excel21m
- Two Means - Matched Pairs (Dependent Samples)42m
- Matched Pairs Hypothesis Test - Excel12m
- 11. Correlation1h 24m
- 12. Regression1h 50m
- 13. Chi-Square Tests & Goodness of Fit2h 21m
- 14. ANOVA1h 57m
6. Normal Distribution and Continuous Random Variables
Probabilities & Z-Scores w/ Graphing Calculator
Problem 7.2.8a
Textbook Question
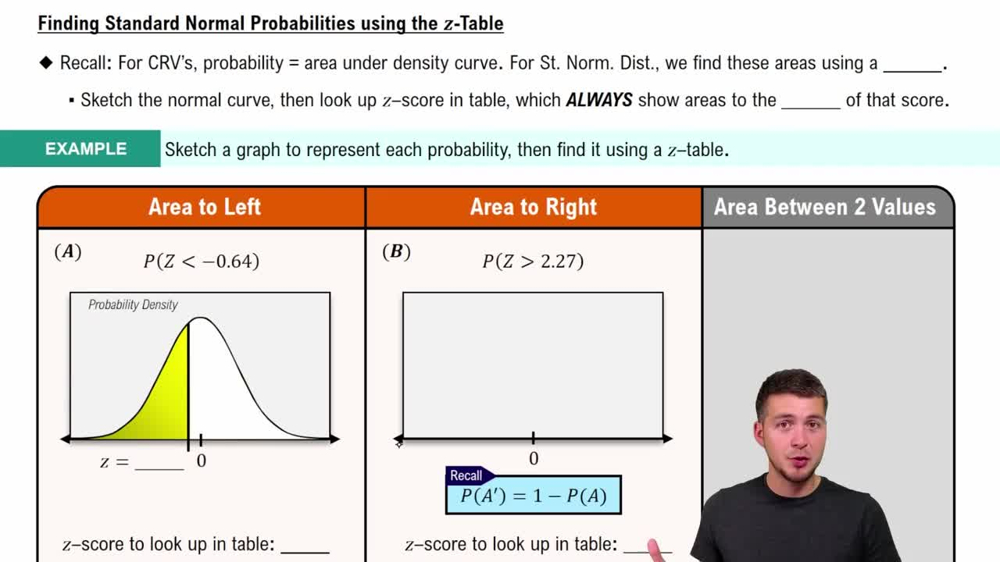
In Problems 5–12, find the indicated areas. For each problem, be sure to draw a standard normal curve and shade the area that is to be found.
Determine the area under the standard normal curve that lies to the right of
a. z = –3.49
Verified step by step guidance1
Understand that the problem asks for the area under the standard normal curve to the right of z = -3.49. The standard normal curve is symmetric with mean 0 and standard deviation 1.
Recall that the total area under the standard normal curve is 1, representing the total probability.
Use the standard normal distribution table (Z-table) or a calculator to find the cumulative area to the left of z = -3.49. This value represents \(P(Z \leq -3.49)\).
Since the problem asks for the area to the right of z = -3.49, calculate this by subtracting the cumulative area to the left from 1: \(P(Z > -3.49) = 1 - P(Z \leq -3.49)\).
Draw a standard normal curve, mark the point z = -3.49 on the horizontal axis, and shade the region to the right of this point to visually represent the area you are calculating.
Verified video answer for a similar problem:This video solution was recommended by our tutors as helpful for the problem above
Video duration:
1mPlay a video:
Was this helpful?
Key Concepts
Here are the essential concepts you must grasp in order to answer the question correctly.
Standard Normal Distribution
The standard normal distribution is a normal distribution with a mean of 0 and a standard deviation of 1. It is symmetric and bell-shaped, used to find probabilities and areas under the curve corresponding to z-scores.
Recommended video:
Guided course
Finding Standard Normal Probabilities using z-Table
Z-Score
A z-score represents the number of standard deviations a data point is from the mean. It standardizes values, allowing comparison across different normal distributions and enabling the use of standard normal tables.
Recommended video:
Guided course
Z-Scores From Given Probability - TI-84 (CE) Calculator
Area Under the Curve
The area under the standard normal curve corresponds to probabilities. Finding the area to the right of a given z-score means calculating the probability that a value is greater than that z-score, often using z-tables or technology.
Recommended video:
Guided course
Z-Scores from Probabilities
Watch next
Master Probability From Given Z-Scores - TI-84 (CE) Calculator with a bite sized video explanation from Patrick
Start learningRelated Videos
Related Practice
Textbook Question
12
views
