What type of variable is required when drawing a time-series plot? Why do we draw time-series plots?
Verified step by step guidance
1
Identify the type of variable required for a time-series plot: it must be a variable measured at successive points in time, typically at equally spaced intervals. This variable is usually quantitative (numerical) and changes over time.
Understand that the time component itself acts as the independent variable, often represented on the x-axis, while the measured variable is plotted on the y-axis.
Recognize that time-series plots are drawn to visualize how a variable evolves over time, helping to detect patterns such as trends, seasonal effects, cycles, or irregular fluctuations.
Note that time-series plots are useful for forecasting future values based on observed historical data and for identifying any anomalies or shifts in the data over time.
Summarize that the key purpose of a time-series plot is to provide a clear graphical representation of temporal dynamics in the data, facilitating better understanding and decision-making.
Verified video answer for a similar problem:
This video solution was recommended by our tutors as helpful for the problem above
Video duration:
5m
Play a video:
0 Comments
Key Concepts
Here are the essential concepts you must grasp in order to answer the question correctly.
Time-Series Variable
A time-series variable is a type of quantitative variable measured sequentially over time, such as daily temperatures or monthly sales. It captures data points at successive time intervals, allowing analysis of trends, patterns, and changes over time.
Time-series plots visually display data points in chronological order, helping to identify trends, seasonal patterns, and fluctuations. They are essential for understanding how a variable evolves over time and for forecasting future values.
Time-series data can be continuous (measured at every instant) or discrete (measured at specific intervals). Understanding this distinction helps in choosing appropriate plotting methods and interpreting the data accurately.

 Verified step by step guidance
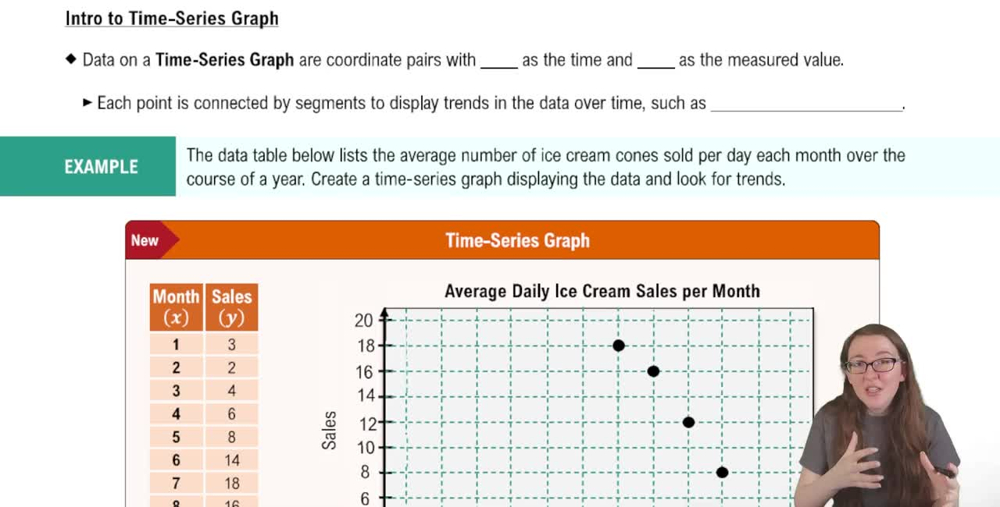
 04:13
04:13