
Textbook Question
Suppose that you roll a die 100 times and get six 80 times. Based on these results, what is the estimated probability that the next roll results in six?
25
views
 Verified step by step guidanceVerified video answer for a similar problem:
 03:10
03:10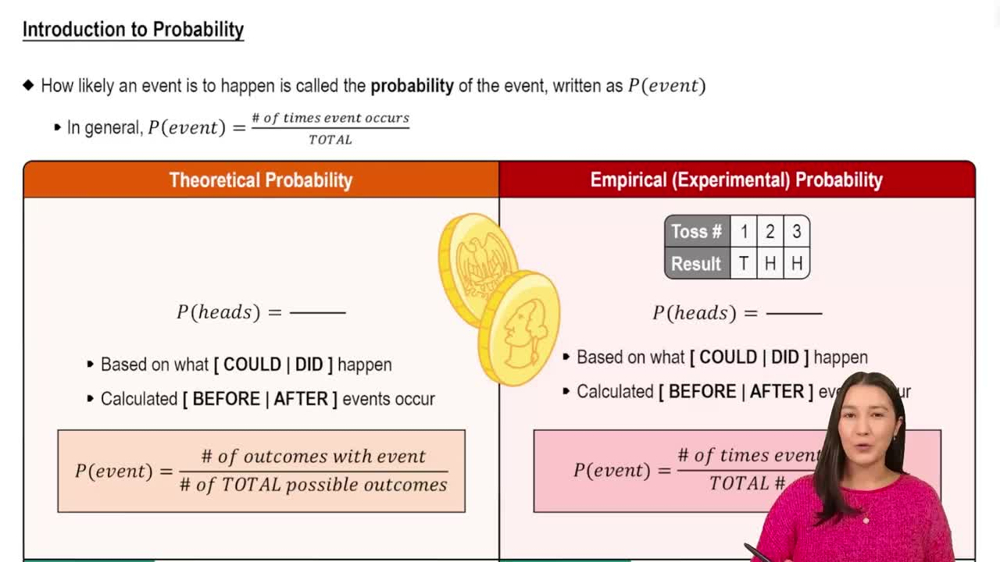 5:37
5:37