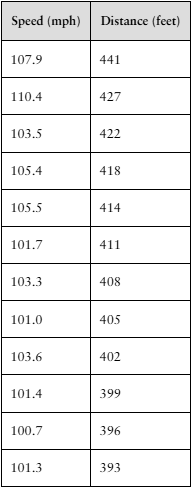
Problems 17–22 use the results from Problems 27–32 in Section 4.1. [DATA] Home Runs (Refer to Problem 31, Section 4.1.) The following data represent the speed at which a ball was hit (in miles per hour) and the distance it traveled (in feet) for a random sample of home runs in a Major League baseball game. b. Explain the meanings of the slope and y-intercept in this context, if appropriate.
Verified step by step guidance
1
Step 1: Understand the variables involved. The independent variable (x) is the speed at which the ball was hit (in mph), and the dependent variable (y) is the distance the ball traveled (in feet).
Step 2: Recall the general form of the linear regression equation: \(y = \beta_0 + \beta_1 x\), where \(\beta_0\) is the y-intercept and \(\beta_1\) is the slope of the line.
Step 3: Interpret the slope (\(\beta_1\)). The slope represents the average change in the distance the ball travels for each one mph increase in the speed of the ball. In other words, it tells us how much farther (or shorter) the ball travels when the speed increases by 1 mph.
Step 4: Interpret the y-intercept (\(\beta_0\)). The y-intercept represents the predicted distance the ball would travel if the speed were 0 mph. In this context, it may not have a practical meaning because a ball hit at 0 mph would not travel any distance, but it is part of the linear model.
Step 5: Summarize the interpretations clearly: The slope quantifies the relationship between speed and distance, showing how distance changes with speed, while the y-intercept is the starting point of the model when speed is zero, which may not be meaningful in this real-world scenario.
Verified video answer for a similar problem:
This video solution was recommended by our tutors as helpful for the problem above
Video duration:
3m
Play a video:
0 Comments
Key Concepts
Here are the essential concepts you must grasp in order to answer the question correctly.
Linear Regression
Linear regression is a statistical method used to model the relationship between a dependent variable and one or more independent variables by fitting a linear equation. In this context, it helps to understand how the speed of the ball (independent variable) affects the distance it travels (dependent variable).
The slope represents the rate of change in the dependent variable for each unit increase in the independent variable. Here, it indicates how much the distance the ball travels changes for each additional mile per hour in speed. A positive slope means distance increases as speed increases.
The y-intercept is the predicted value of the dependent variable when the independent variable is zero. In this scenario, it would represent the estimated distance the ball would travel if the speed were zero, which may or may not be meaningful depending on the context.

 Verified step by step guidance
 07:01
07:01