[DATA] Putting It Together: Red Light Cameras Chicago has installed cameras at various intersections throughout the city. The camera photographs the license plate of any car engaging in a moving violation (such as driving through a red light or failure to completely stop prior to turning on red). Open the data set 2_2_35, which represents the number of violations recorded by all cameras on October 17, 2018. The data set is located at www.pearsonhighered.com/sullivanstats.
f. Were there any cameras that did not record any violations on October 17, 2018? If so, how many?
Verified step by step guidance
1
Step 1: Access the data set named 2_2_35 from the provided source, which contains the number of violations recorded by each red light camera on October 17, 2018.
Step 2: Review the data entries for each camera to identify the number of violations recorded. Each entry should represent the count of violations for a specific camera.
Step 3: Look for any cameras that have a recorded violation count of zero. This means those cameras did not capture any moving violations on that day.
Step 4: Count the total number of cameras with zero violations to determine how many cameras did not record any violations on October 17, 2018.
Step 5: Summarize your findings by reporting the number of cameras with zero violations, which answers the question directly.
Verified video answer for a similar problem:
This video solution was recommended by our tutors as helpful for the problem above
Video duration:
1m
Play a video:
0 Comments
Key Concepts
Here are the essential concepts you must grasp in order to answer the question correctly.
Frequency Distribution
A frequency distribution summarizes how often each value occurs in a data set. In this context, it helps identify how many cameras recorded zero violations by counting the number of times '0' appears in the data. This is essential for answering whether any cameras had no violations.
Data inspection involves reviewing the data set carefully to identify specific values or patterns. Counting is the process of tallying occurrences of a particular value, such as zero violations. Together, these skills allow you to determine how many cameras recorded no violations on the given date.
Descriptive statistics summarize and describe features of a data set, including measures like counts, frequencies, and proportions. Understanding these helps interpret the data meaningfully, such as quantifying how many cameras had zero violations and providing insight into traffic enforcement effectiveness.

 Verified step by step guidance
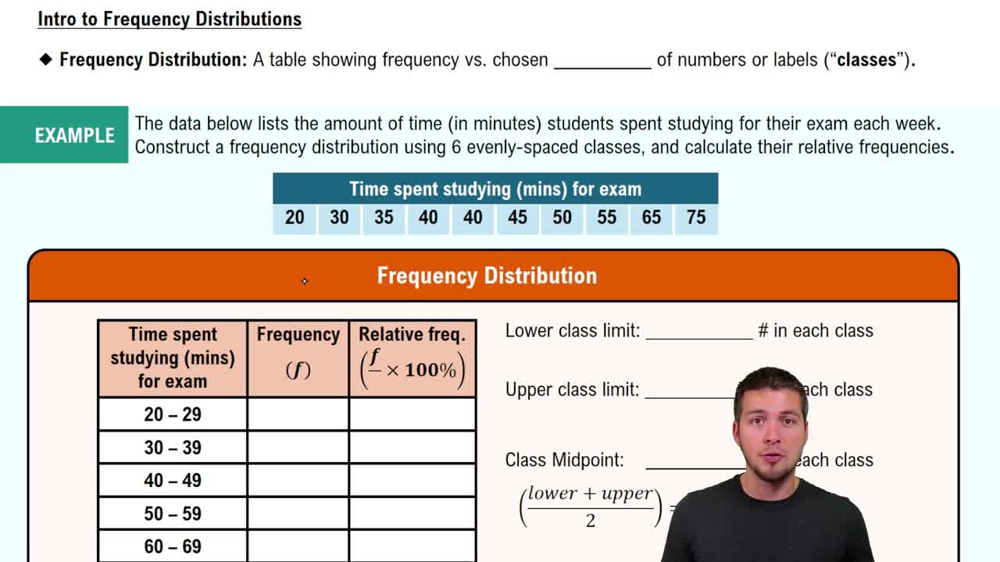
 06:38
06:38