A frequency distribution lists the _____of occurrences of each category of data, while a relative frequency distribution lists the______of occurrences of each category of data.
Table of contents
- 1. Intro to Stats and Collecting Data1h 14m
- 2. Describing Data with Tables and Graphs1h 56m
- 3. Describing Data Numerically2h 5m
- 4. Probability2h 17m
- 5. Binomial Distribution & Discrete Random Variables3h 6m
- 6. Normal Distribution and Continuous Random Variables2h 11m
- 7. Sampling Distributions & Confidence Intervals: Mean3h 23m
- Sampling Distribution of the Sample Mean and Central Limit Theorem19m
- Distribution of Sample Mean - ExcelBonus23m
- Introduction to Confidence Intervals15m
- Confidence Intervals for Population Mean1h 18m
- Determining the Minimum Sample Size Required12m
- Finding Probabilities and T Critical Values - ExcelBonus28m
- Confidence Intervals for Population Means - ExcelBonus25m
- 8. Sampling Distributions & Confidence Intervals: Proportion2h 10m
- 9. Hypothesis Testing for One Sample5h 8m
- Steps in Hypothesis Testing1h 6m
- Performing Hypothesis Tests: Means1h 4m
- Hypothesis Testing: Means - ExcelBonus42m
- Performing Hypothesis Tests: Proportions37m
- Hypothesis Testing: Proportions - ExcelBonus27m
- Performing Hypothesis Tests: Variance12m
- Critical Values and Rejection Regions28m
- Link Between Confidence Intervals and Hypothesis Testing12m
- Type I & Type II Errors16m
- 10. Hypothesis Testing for Two Samples5h 37m
- Two Proportions1h 13m
- Two Proportions Hypothesis Test - ExcelBonus28m
- Two Means - Unknown, Unequal Variance1h 3m
- Two Means - Unknown Variances Hypothesis Test - ExcelBonus12m
- Two Means - Unknown, Equal Variance15m
- Two Means - Unknown, Equal Variances Hypothesis Test - ExcelBonus9m
- Two Means - Known Variance12m
- Two Means - Sigma Known Hypothesis Test - ExcelBonus21m
- Two Means - Matched Pairs (Dependent Samples)42m
- Matched Pairs Hypothesis Test - ExcelBonus12m
- Two Variances and F Distribution29m
- Two Variances - Graphing CalculatorBonus16m
- 11. Correlation1h 24m
- 12. Regression3h 33m
- Linear Regression & Least Squares Method26m
- Residuals12m
- Coefficient of Determination12m
- Regression Line Equation and Coefficient of Determination - ExcelBonus8m
- Finding Residuals and Creating Residual Plots - ExcelBonus11m
- Inferences for Slope31m
- Enabling Data Analysis ToolpakBonus1m
- Regression Readout of the Data Analysis Toolpak - ExcelBonus21m
- Prediction Intervals13m
- Prediction Intervals - ExcelBonus19m
- Multiple Regression - ExcelBonus29m
- Quadratic Regression15m
- Quadratic Regression - ExcelBonus10m
- 13. Chi-Square Tests & Goodness of Fit2h 21m
- 14. ANOVA2h 29m
2. Describing Data with Tables and Graphs
Frequency Distributions
Problem 2.2.1
Textbook Question
The categories by which data are grouped are called ________.
Verified step by step guidance1
Understand that in statistics, when we collect data, we often organize it into groups to make analysis easier.
These groups or labels that classify data into different segments are known as categories.
The specific term used to describe these categories or groups in which data is classified is called 'variables' or more precisely 'categorical variables' when referring to qualitative data.
However, the general term for the groups themselves, by which data is grouped, is 'classes' or 'categories'.
Therefore, the blank in the sentence 'The categories by which data are grouped are called ________.' should be filled with the word 'categories' or 'classes', depending on the context.
Verified video answer for a similar problem:
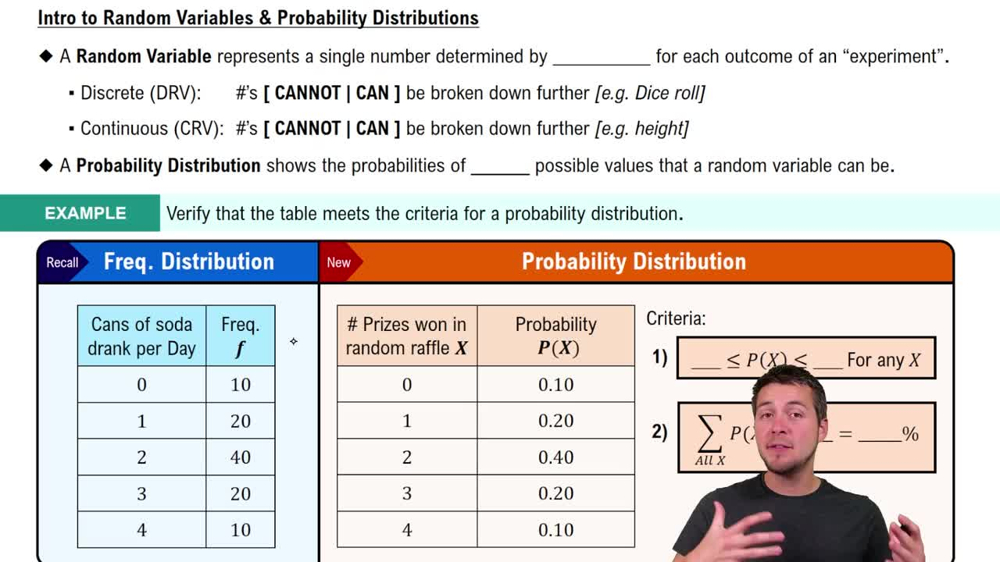
This video solution was recommended by our tutors as helpful for the problem above
Video duration:
56sPlay a video:
0 Comments
Key Concepts
Here are the essential concepts you must grasp in order to answer the question correctly.
Categorical Variables
Categorical variables represent data that can be divided into distinct groups or categories, such as gender, color, or type. These categories are qualitative and describe attributes rather than numerical values.
Recommended video:
Guided course
Intro to Random Variables & Probability Distributions
Categories (or Levels)
Categories, also known as levels, are the specific groups or labels within a categorical variable. For example, in the variable 'color,' categories might be red, blue, and green, which help organize and analyze data.
Recommended video:
Introduction to Contingency Tables
Data Grouping
Data grouping involves organizing data points into categories to simplify analysis and interpretation. Grouping helps identify patterns and relationships within qualitative data by sorting observations into meaningful classes.
Recommended video:
Introduction to Collecting Data
Related Videos
Related Practice
Textbook Question
48
views
