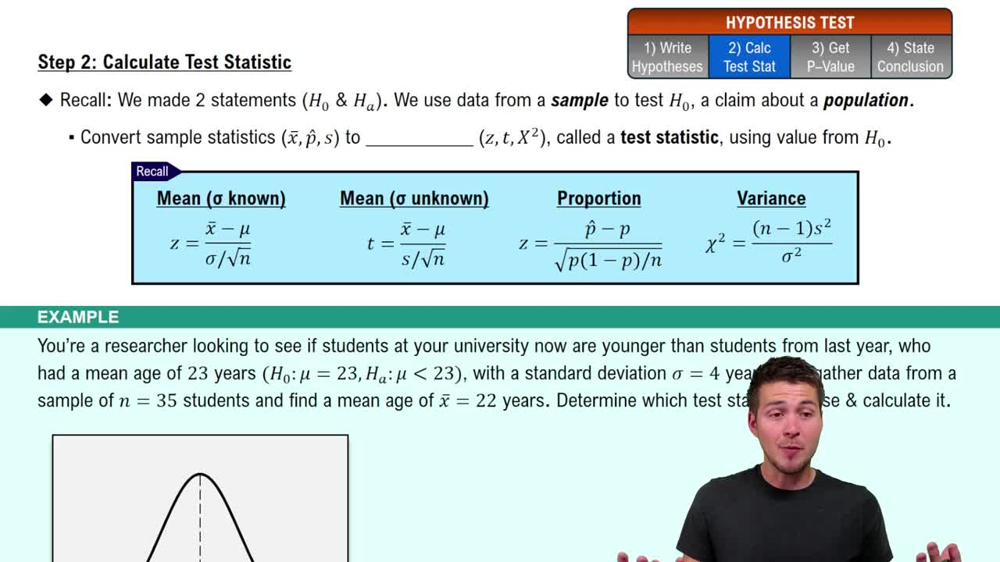
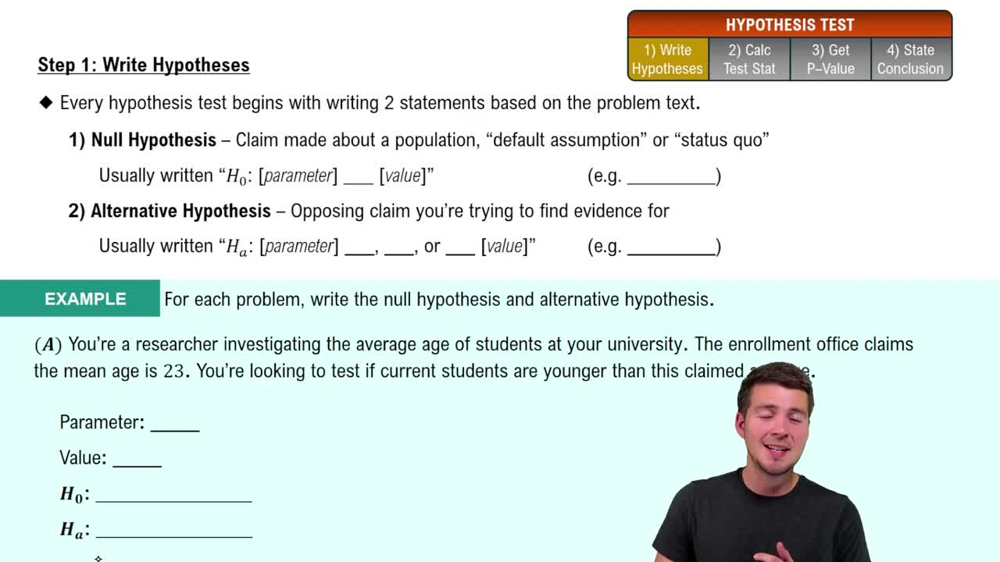
Milk Containers A machine is set to fill milk containers with a mean of 64 ounces and a standard deviation of 0.11 ounce. A random sample of 40 containers has a mean of 64.05 ounces. The machine needs to be reset when the mean of a random sample is unusual. Does the machine need to be reset? Explain.
Table of contents
- 1. Intro to Stats and Collecting Data1h 14m
- 2. Describing Data with Tables and Graphs1h 55m
- 3. Describing Data Numerically2h 5m
- 4. Probability2h 16m
- 5. Binomial Distribution & Discrete Random Variables3h 6m
- 6. Normal Distribution and Continuous Random Variables2h 11m
- 7. Sampling Distributions & Confidence Intervals: Mean3h 23m
- Sampling Distribution of the Sample Mean and Central Limit Theorem19m
- Distribution of Sample Mean - Excel23m
- Introduction to Confidence Intervals15m
- Confidence Intervals for Population Mean1h 18m
- Determining the Minimum Sample Size Required12m
- Finding Probabilities and T Critical Values - Excel28m
- Confidence Intervals for Population Means - Excel25m
- 8. Sampling Distributions & Confidence Intervals: Proportion1h 25m
- 9. Hypothesis Testing for One Sample3h 29m
- 10. Hypothesis Testing for Two Samples4h 50m
- Two Proportions1h 13m
- Two Proportions Hypothesis Test - Excel28m
- Two Means - Unknown, Unequal Variance1h 3m
- Two Means - Unknown Variances Hypothesis Test - Excel12m
- Two Means - Unknown, Equal Variance15m
- Two Means - Unknown, Equal Variances Hypothesis Test - Excel9m
- Two Means - Known Variance12m
- Two Means - Sigma Known Hypothesis Test - Excel21m
- Two Means - Matched Pairs (Dependent Samples)42m
- Matched Pairs Hypothesis Test - Excel12m
- 11. Correlation1h 24m
- 12. Regression1h 50m
- 13. Chi-Square Tests & Goodness of Fit2h 21m
- 14. ANOVA1h 57m
9. Hypothesis Testing for One Sample
Performing Hypothesis Tests: Means
Problem 7.2.33
Textbook Question
Hypothesis Testing Using a P-Value In Exercises 33–38,
a. identify the claim and state and .
b. find the standardized test statistic z.
c. find the corresponding P-value.
d. decide whether to reject or fail to reject the null hypothesis.
e. interpret the decision in the context of the original claim.
MCAT Scores A random sample of 100 medical school applicants at a university has a mean total score of 505 on the MCAT. According to a report, the mean total score for the school’s applicants is more than 503. Assume the population standard deviation is 10.6. At alpha=0.01, is there enough evidence to support the report’s claim?
Verified step by step guidance1
Step 1: Identify the claim and state the null hypothesis (H₀) and the alternative hypothesis (H₁). The claim is that the mean total score for the school’s applicants is more than 503. This is a one-tailed test. H₀: μ ≤ 503 (the mean is less than or equal to 503), and H₁: μ > 503 (the mean is greater than 503).
Step 2: Calculate the standardized test statistic z. Use the formula: , where x̄ is the sample mean (505), μ is the population mean under H₀ (503), σ is the population standard deviation (10.6), and n is the sample size (100).
Step 3: Find the corresponding P-value. Use the z-value obtained in Step 2 and refer to the standard normal distribution table (or use statistical software) to find the P-value for the one-tailed test.
Step 4: Compare the P-value to the significance level α = 0.01. If the P-value is less than α, reject the null hypothesis H₀. Otherwise, fail to reject H₀.
Step 5: Interpret the decision in the context of the original claim. If H₀ is rejected, there is enough evidence to support the claim that the mean total score for the school’s applicants is more than 503. If H₀ is not rejected, there is not enough evidence to support the claim.
Verified video answer for a similar problem:This video solution was recommended by our tutors as helpful for the problem above
Video duration:
6mPlay a video:
Was this helpful?
Key Concepts
Here are the essential concepts you must grasp in order to answer the question correctly.
Hypothesis Testing
Hypothesis testing is a statistical method used to make decisions about a population based on sample data. It involves formulating two competing hypotheses: the null hypothesis (H0), which represents a statement of no effect or no difference, and the alternative hypothesis (H1), which indicates the presence of an effect or difference. The goal is to determine whether there is enough evidence in the sample data to reject the null hypothesis in favor of the alternative.
Recommended video:
Guided course
Step 1: Write Hypotheses
P-Value
The P-value is a measure that helps determine the strength of the evidence against the null hypothesis. It represents the probability of obtaining a test statistic as extreme as, or more extreme than, the observed value, assuming the null hypothesis is true. A smaller P-value indicates stronger evidence against the null hypothesis, and researchers typically compare the P-value to a predetermined significance level (alpha) to decide whether to reject H0.
Recommended video:
Guided course
Step 3: Get P-Value
Standardized Test Statistic (z)
The standardized test statistic, often denoted as z, is a value that indicates how many standard deviations an element is from the mean. In hypothesis testing, it is calculated using the sample mean, population mean, population standard deviation, and sample size. The z-score helps to determine the position of the sample mean in relation to the null hypothesis and is essential for finding the corresponding P-value.
Recommended video:
Guided course
Step 2: Calculate Test Statistic
Watch next
Master Standard Deviation (σ) Known with a bite sized video explanation from Patrick
Start learningRelated Videos
Related Practice
Textbook Question
17
views
