Ch. 4 - Discrete Probability Distributions
Larson - Elementary Statistics: Picturing the World 8th Edition
Larson8th EditionElementary Statistics: Picturing the WorldISBN: 9780137493470Not the one you use?Change textbook
Chapter 4, Problem 4.3.19

"Using a Distribution to Find Probabilities In Exercises 11–26, find the indicated probabilities using the geometric distribution, the Poisson distribution, or the binomial distribution. Then determine whether the events are unusual. If convenient, use a table or technology to find the probabilities.


Hurricanes The mean number of hurricanes to strike the U.S. mainland per year from 1851 through 2020 was about 1.8. Find the probability that the number of hurricanes striking the U.S. mainland in any given year from 1851 through 2020 is (a) exactly one, (b) at most one, and (c) more than one. (Source: National Oceanic & Atmospheric Administration)"

Verified step by step guidance
1
Step 1: Identify the type of probability distribution to use. Since the problem involves the mean number of hurricanes per year (1.8) and asks for probabilities of discrete events (exactly one, at most one, more than one), the Poisson distribution is appropriate. The Poisson distribution is used to model the number of occurrences of an event in a fixed interval of time or space, given a known average rate (λ).
Step 2: Write the formula for the Poisson probability distribution. The probability of observing k events in a Poisson distribution is given by: P(k) = (λk * e) / k!, where λ is the mean number of occurrences, k is the number of occurrences, and e is the base of the natural logarithm (approximately 2.718).
Step 3: Solve part (a) for exactly one hurricane. Substitute λ = 1.8 and k = 1 into the formula: P(1) = (1.81 * e-1.8) / 1!. Simplify the expression to find the probability.
Step 4: Solve part (b) for at most one hurricane. 'At most one' means k = 0 or k = 1. Calculate the probabilities for k = 0 and k = 1 using the formula, then add them together: P(k ≤ 1) = P(0) + P(1). For k = 0, substitute λ = 1.8 and k = 0 into the formula: P(0) = (1.80 * e-1.8) / 0!. For k = 1, use the result from part (a).
Step 5: Solve part (c) for more than one hurricane. 'More than one' means k > 1. Use the complement rule: P(k > 1) = 1 - P(k ≤ 1). Use the result from part (b) to calculate the complement probability.

Verified video answer for a similar problem:

This video solution was recommended by our tutors as helpful for the problem above.
Video duration:
2m
Was this helpful?

Key Concepts

Here are the essential concepts you must grasp in order to answer the question correctly.

Poisson Distribution

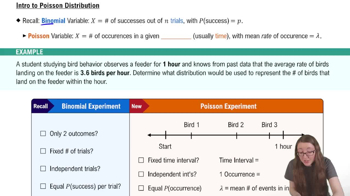
The Poisson distribution is a probability distribution that expresses the probability of a given number of events occurring in a fixed interval of time or space, given a known average rate of occurrence. It is particularly useful for modeling rare events, such as the number of hurricanes in a year, where the events are independent. The formula for the Poisson probability mass function is P(X=k) = (λ^k * e^(-λ)) / k!, where λ is the average rate, k is the number of occurrences, and e is Euler's number.
Recommended video:
04:00
Introduction to the Poisson Distribution

Mean and Unusual Events

The mean, or expected value, of a probability distribution is a measure of the central tendency, representing the average outcome over a long period. In the context of the Poisson distribution, the mean also indicates the average number of events (e.g., hurricanes) expected in a given timeframe. An event is considered unusual if its probability is significantly low, often defined as less than 5%, prompting further investigation into its occurrence.
Recommended video:
05:54
Probability of Multiple Independent Events

Cumulative Probability

Cumulative probability refers to the probability that a random variable takes on a value less than or equal to a specific value. In the context of the question, calculating the cumulative probability for hurricanes striking the U.S. mainland involves finding the probability of having at most one hurricane in a year. This is done by summing the probabilities of having zero and one hurricane, which can be efficiently calculated using the Poisson distribution.
Recommended video:
5:37
Introduction to Probability
Related Practice
Textbook Question

Identifying Probability Distributions In Exercises 27 and 28, determine whether the distribution is a probability distribution. If it is not a probability distribution, explain why.

195
views

Textbook Question

Finding the Mean, Variance, and Standard Deviation In Exercises 29–34, (a) find the mean, variance, and standard deviation of the probability distribution, and (b) interpret the results.

Dogs The number of dogs per household in a neighborhood

251
views
Textbook Question

Discrete Variables and Continuous Variables In Exercises 13–18, determine whether the random variable x is discrete or continuous. Explain.


Let x represent the populations of the 50 U.S. states.

144
views
Textbook Question

Determining a Missing Probability In Exercises 25 and 26, determine the missing probability for the probability distribution.

162
views
Textbook Question

Graphical Analysis In Exercises 3–5, the histogram represents a binomial distribution with five trials. Match the histogram with the appropriate probability of success p. Explain your reasoning.

a. p = 0.25

b. p = 0.50

c. p = 0.75


81
views
Textbook Question

Finding an Expected Value In Exercises 37 and 38, find the expected value E(x) to the player for one play of the game. If x is the gain to a player in a game of chance, then E(x) is usually negative. This value gives the average amount per game the player can expect to lose.


In American roulette, the wheel has the 38 numbers, 00, 0, 1, 2, . . ., 34, 35, and 36, marked on equally spaced slots. If a player bets \$1 on a number and wins, then the player keeps the dollar and receives an additional \$35. Otherwise, the dollar is lost.

112
views